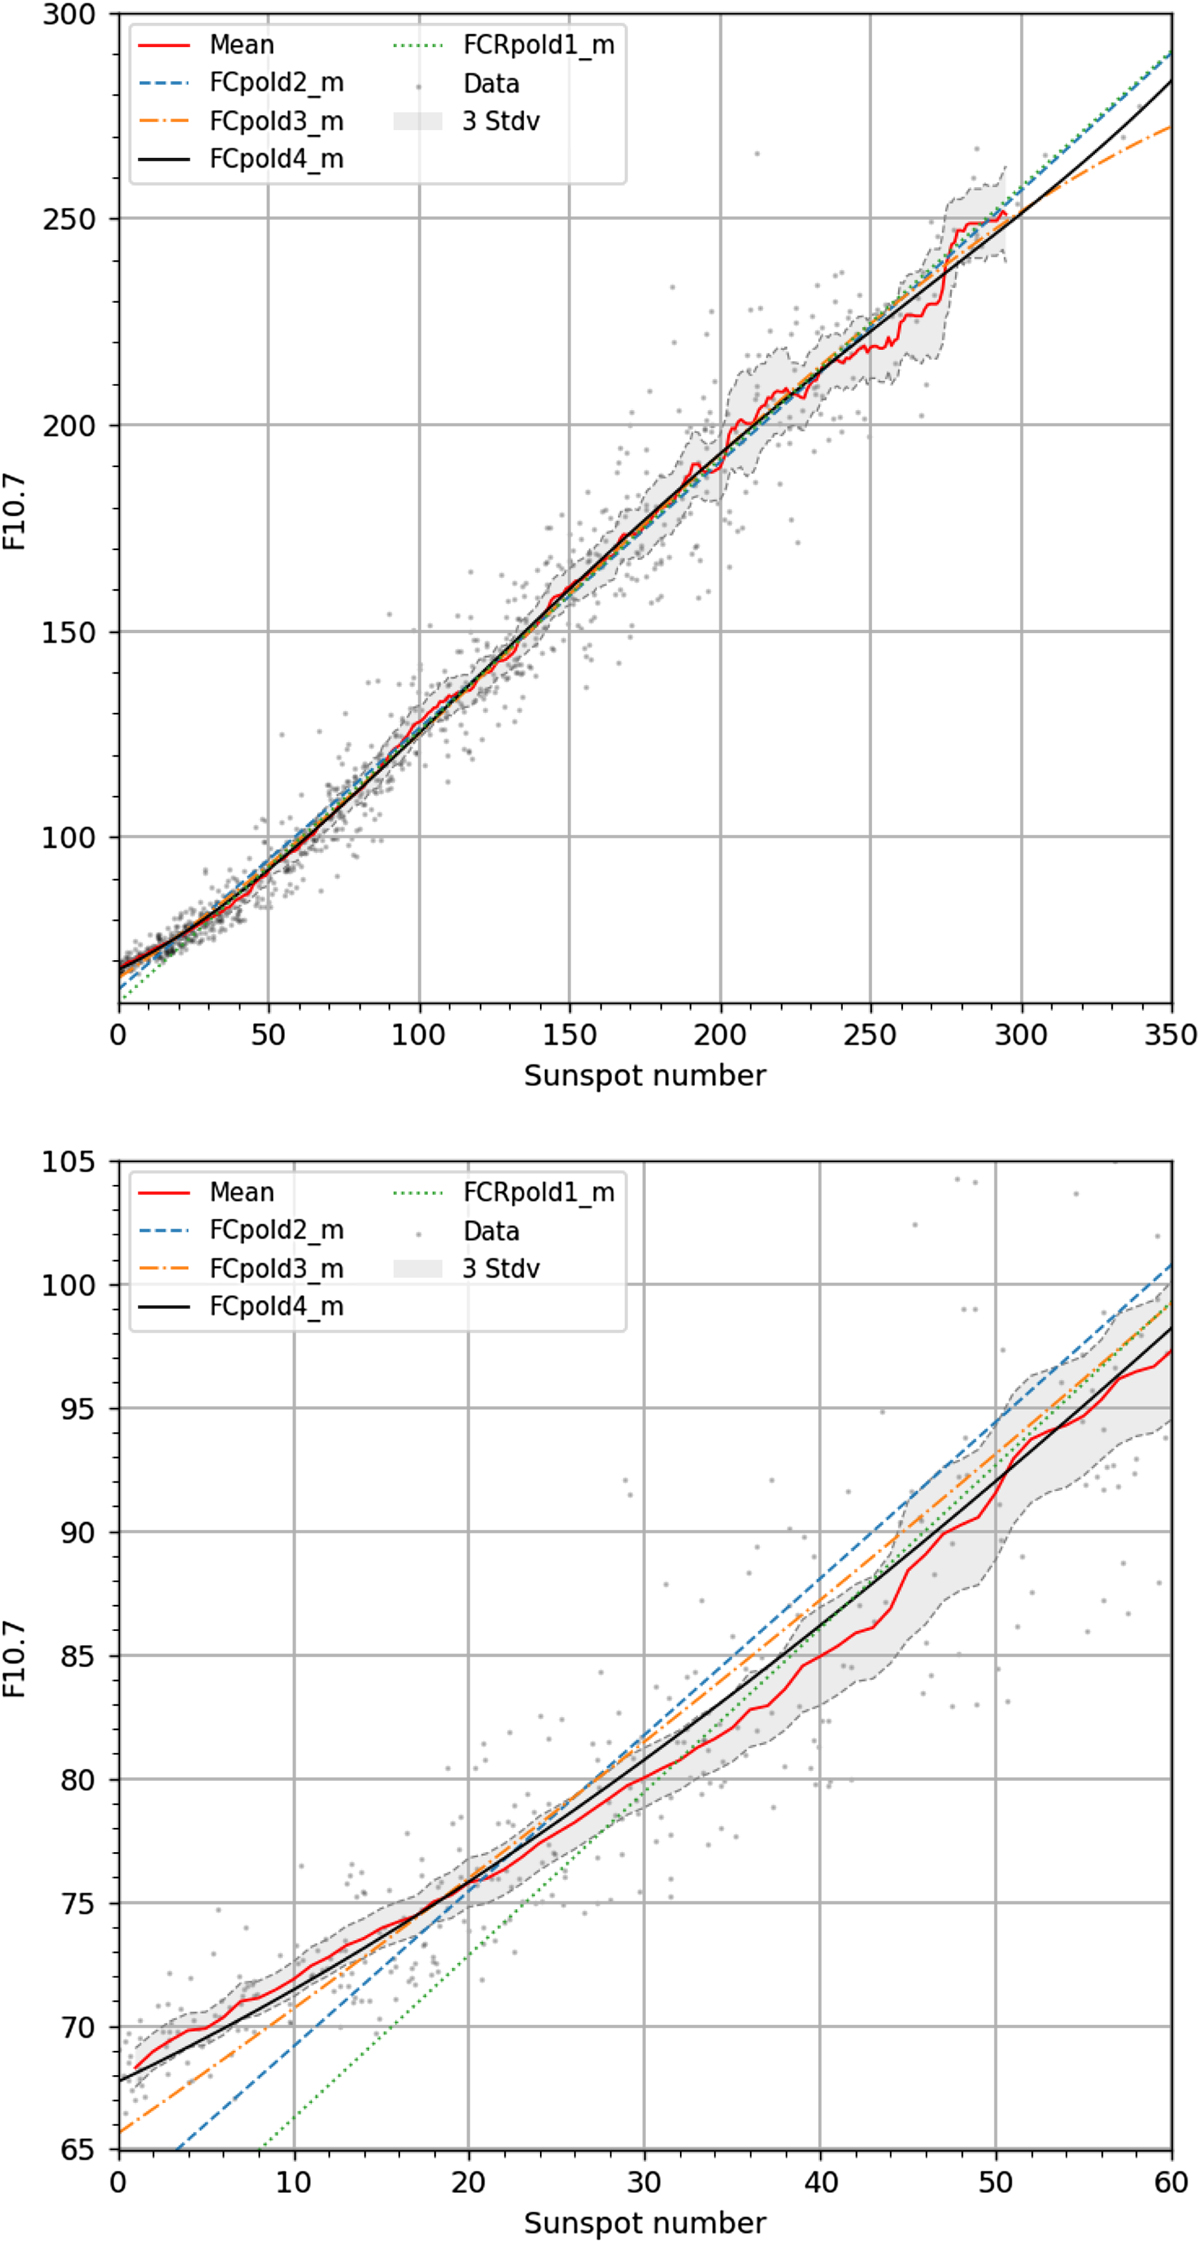
Fig. 11
Download original image
Polynomial of order 1 (linear fit) to 4 fitted to the monthly mean data by ordinary least-square regression (OLS). The curves are superimposed on the corresponding non-parametric mean (cf. Fig. 5) to show the agreement within 3-σm, and on the base data (gray dots). The lower plot is a close-up view of the low range of the upper plot.
Current usage metrics show cumulative count of Article Views (full-text article views including HTML views, PDF and ePub downloads, according to the available data) and Abstracts Views on Vision4Press platform.
Data correspond to usage on the plateform after 2015. The current usage metrics is available 48-96 hours after online publication and is updated daily on week days.
Initial download of the metrics may take a while.