Fig. 18
Download original image
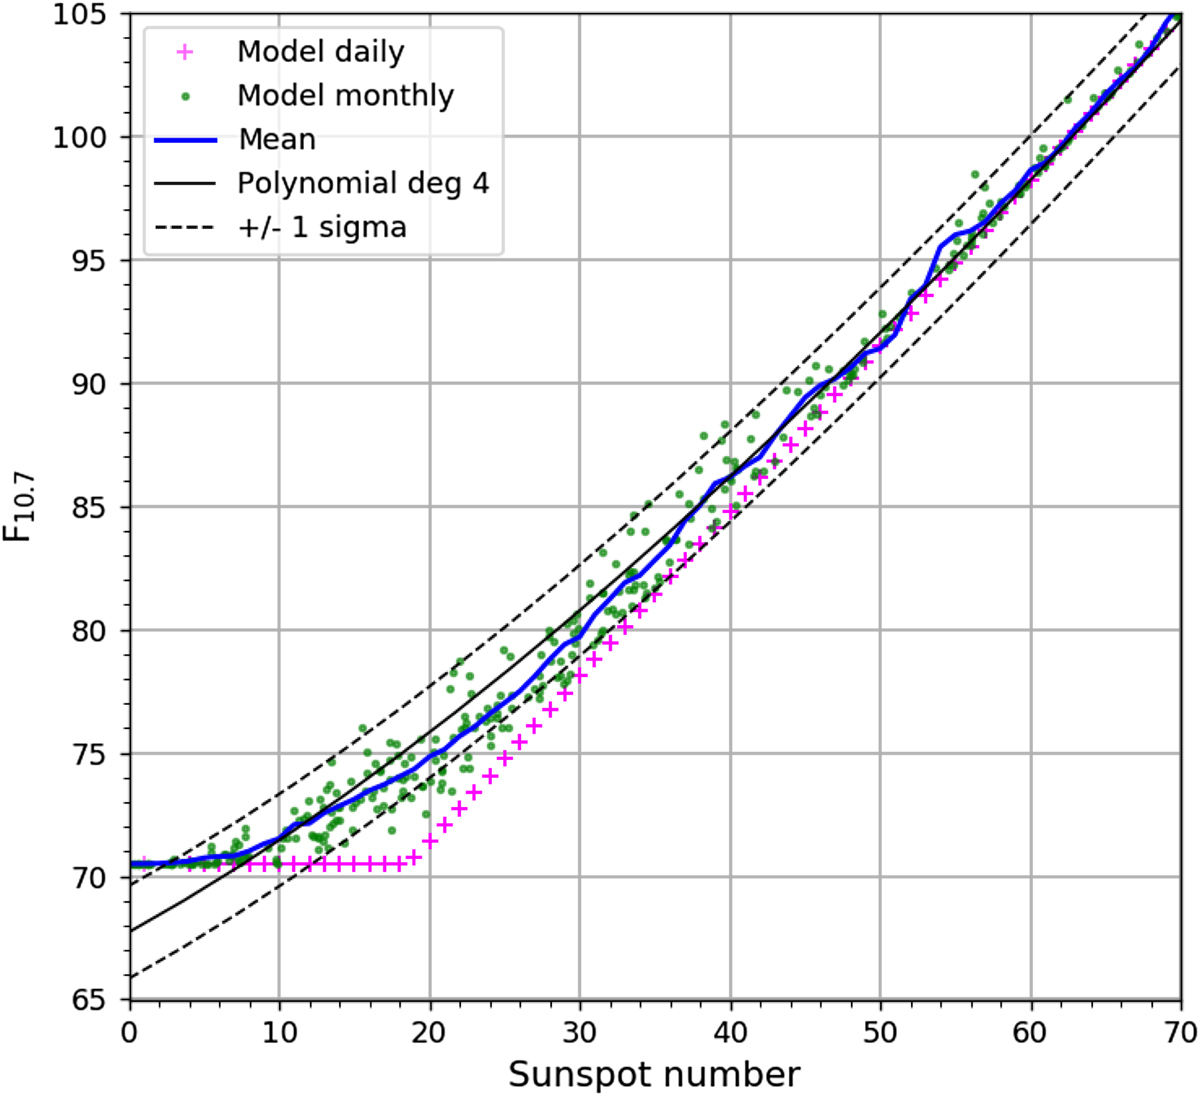
Model of the monthly temporal averaging of daily data built from two components: linear component and constant lower background at 70.5 sfu. The pink crosses are the synthesized daily values. The green dots are the corresponding monthly mean values, and the blue line is the non-parametric local mean of those values. As a comparison, the black line is the 4th-order polynomial fitted to the real monthly mean data (Table 3), with uncertainties (black dashes lines).
Current usage metrics show cumulative count of Article Views (full-text article views including HTML views, PDF and ePub downloads, according to the available data) and Abstracts Views on Vision4Press platform.
Data correspond to usage on the plateform after 2015. The current usage metrics is available 48-96 hours after online publication and is updated daily on week days.
Initial download of the metrics may take a while.