Fig. 2
Download original image
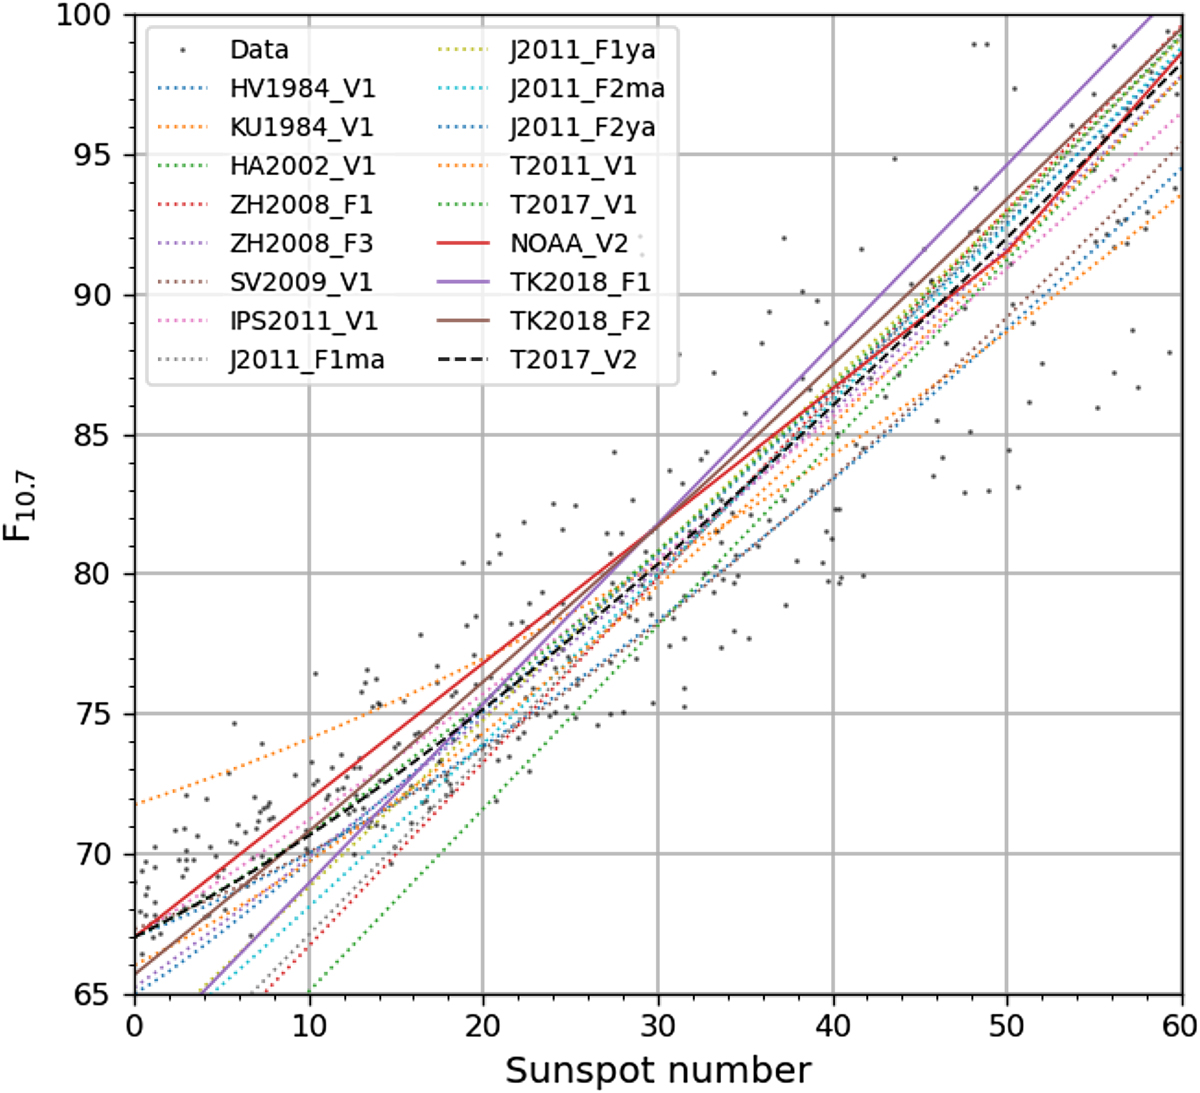
Combined plot of past published proxy relations giving F10.7 as a function of the sunspot number: close-up view of the low-activity range of Figure 1. The curves are labeled according to the identification in column 4 of Table 1. The curves are superimposed on the observed monthly mean values (gray dots).
Current usage metrics show cumulative count of Article Views (full-text article views including HTML views, PDF and ePub downloads, according to the available data) and Abstracts Views on Vision4Press platform.
Data correspond to usage on the plateform after 2015. The current usage metrics is available 48-96 hours after online publication and is updated daily on week days.
Initial download of the metrics may take a while.