Fig. 21
Download original image
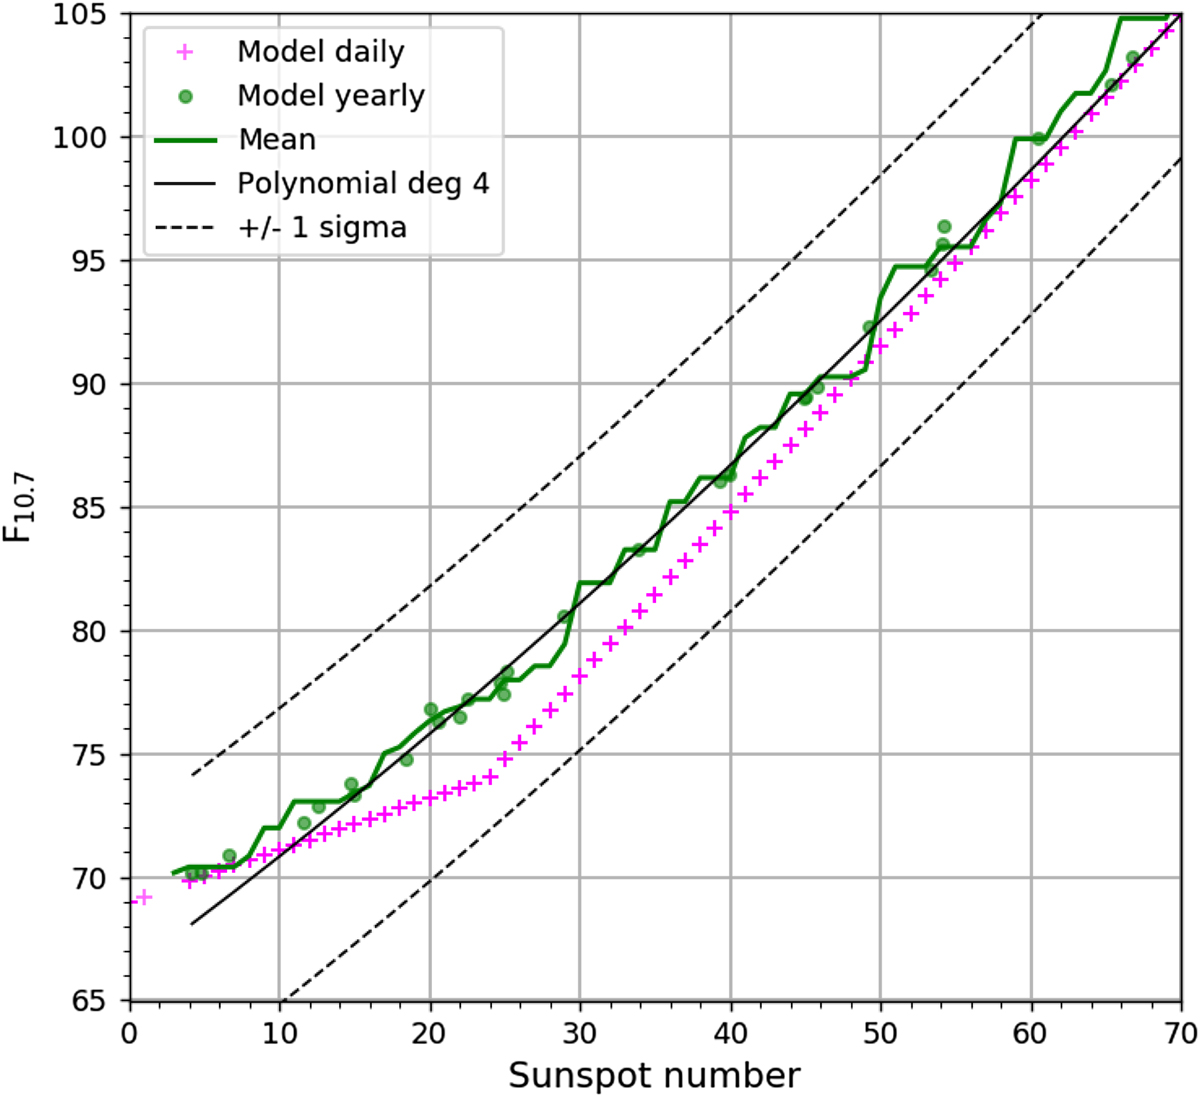
Model of the yearly temporal averaging of daily data built from two components: linear relation and slightly rising background with increasing SN. The elements of the plots are the same as in Figure 18.
Current usage metrics show cumulative count of Article Views (full-text article views including HTML views, PDF and ePub downloads, according to the available data) and Abstracts Views on Vision4Press platform.
Data correspond to usage on the plateform after 2015. The current usage metrics is available 48-96 hours after online publication and is updated daily on week days.
Initial download of the metrics may take a while.