Fig. 22
Download original image
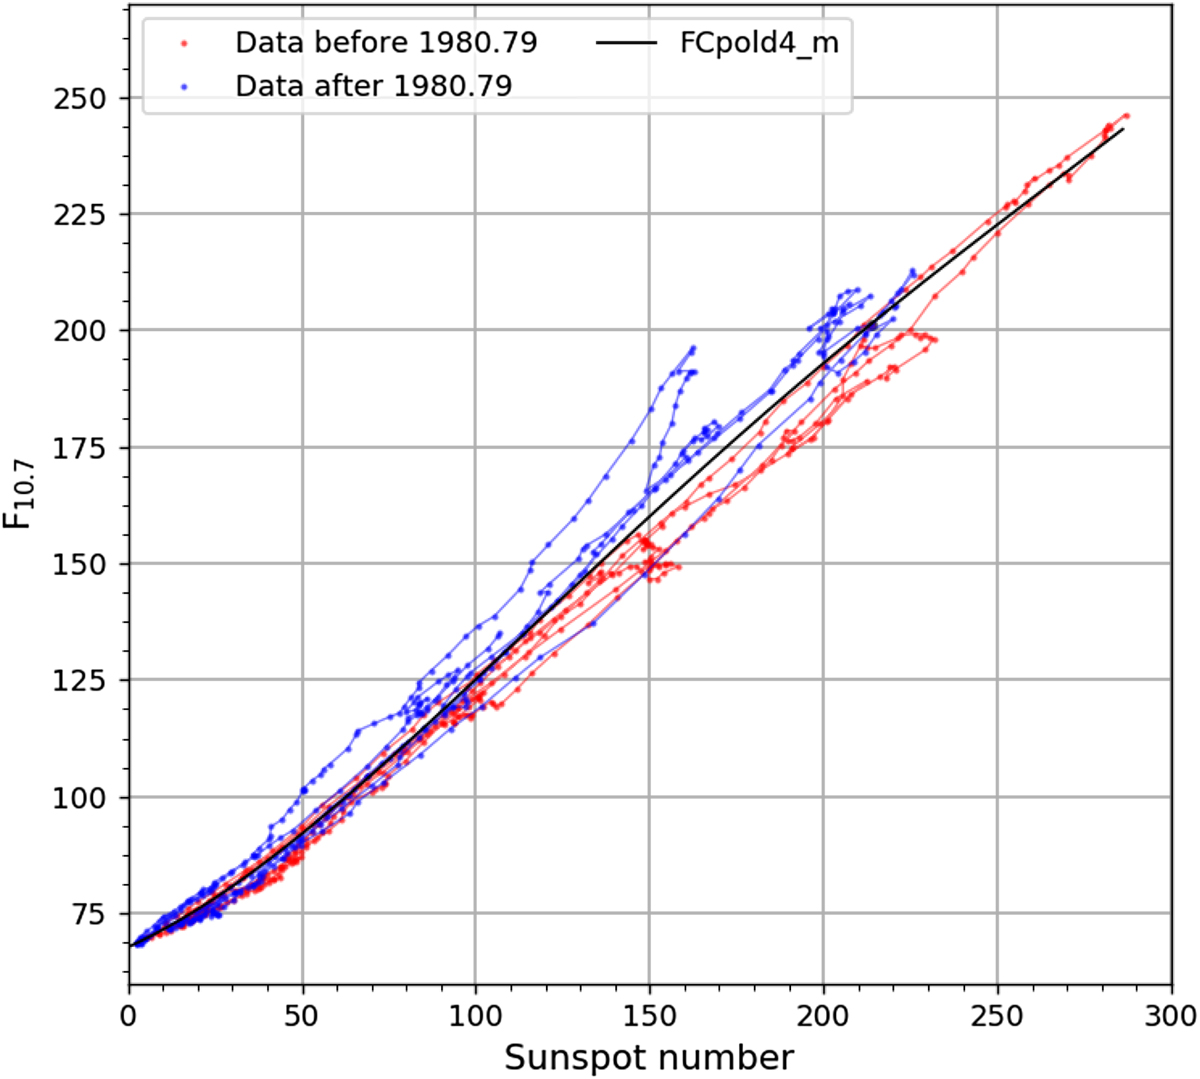
Plot of F10.7 versus SN, using the original SN series (version 1). The data are smoothed by a 13-month running mean. The line connects successive months, and thus illustrate the chronological evolution. The curve is colored in blue or red for dates before and after 1981.
Current usage metrics show cumulative count of Article Views (full-text article views including HTML views, PDF and ePub downloads, according to the available data) and Abstracts Views on Vision4Press platform.
Data correspond to usage on the plateform after 2015. The current usage metrics is available 48-96 hours after online publication and is updated daily on week days.
Initial download of the metrics may take a while.