Fig. 27
Download original image
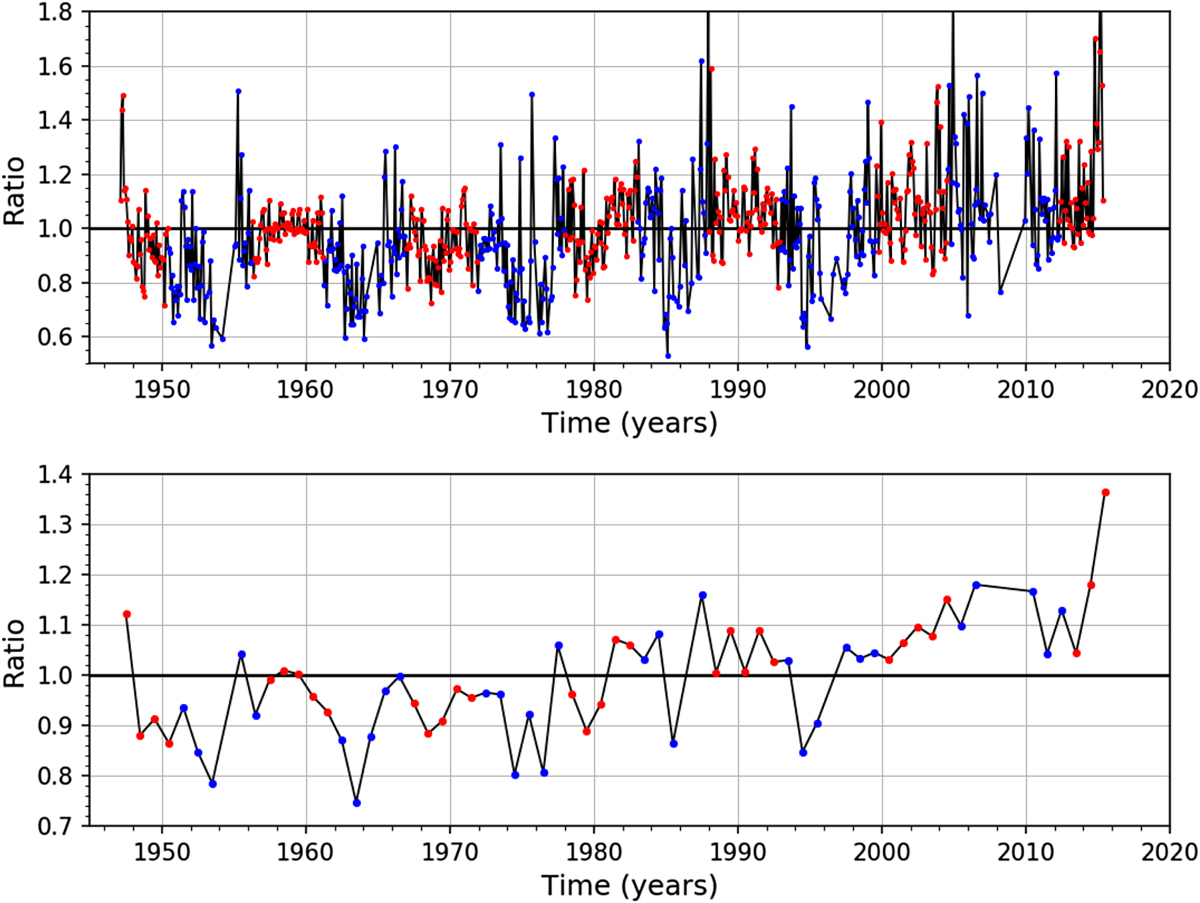
Temporal variation of the ratio between the monthly mean F10.7 flux and a constant proxy relation (4th-order polynomial) (upper panel), after subtracting a 67 sfu quiet-Sun base flux. The same ratio for the yearly mean F10.7 flux is shown in the lower panel. The points near cycle maxima and minima are colored in blue and red respectively. The monthly means show a slight solar-cycle modulation, and both curves show the 1980 jump between two stable periods.
Current usage metrics show cumulative count of Article Views (full-text article views including HTML views, PDF and ePub downloads, according to the available data) and Abstracts Views on Vision4Press platform.
Data correspond to usage on the plateform after 2015. The current usage metrics is available 48-96 hours after online publication and is updated daily on week days.
Initial download of the metrics may take a while.