Fig. 3
Download original image
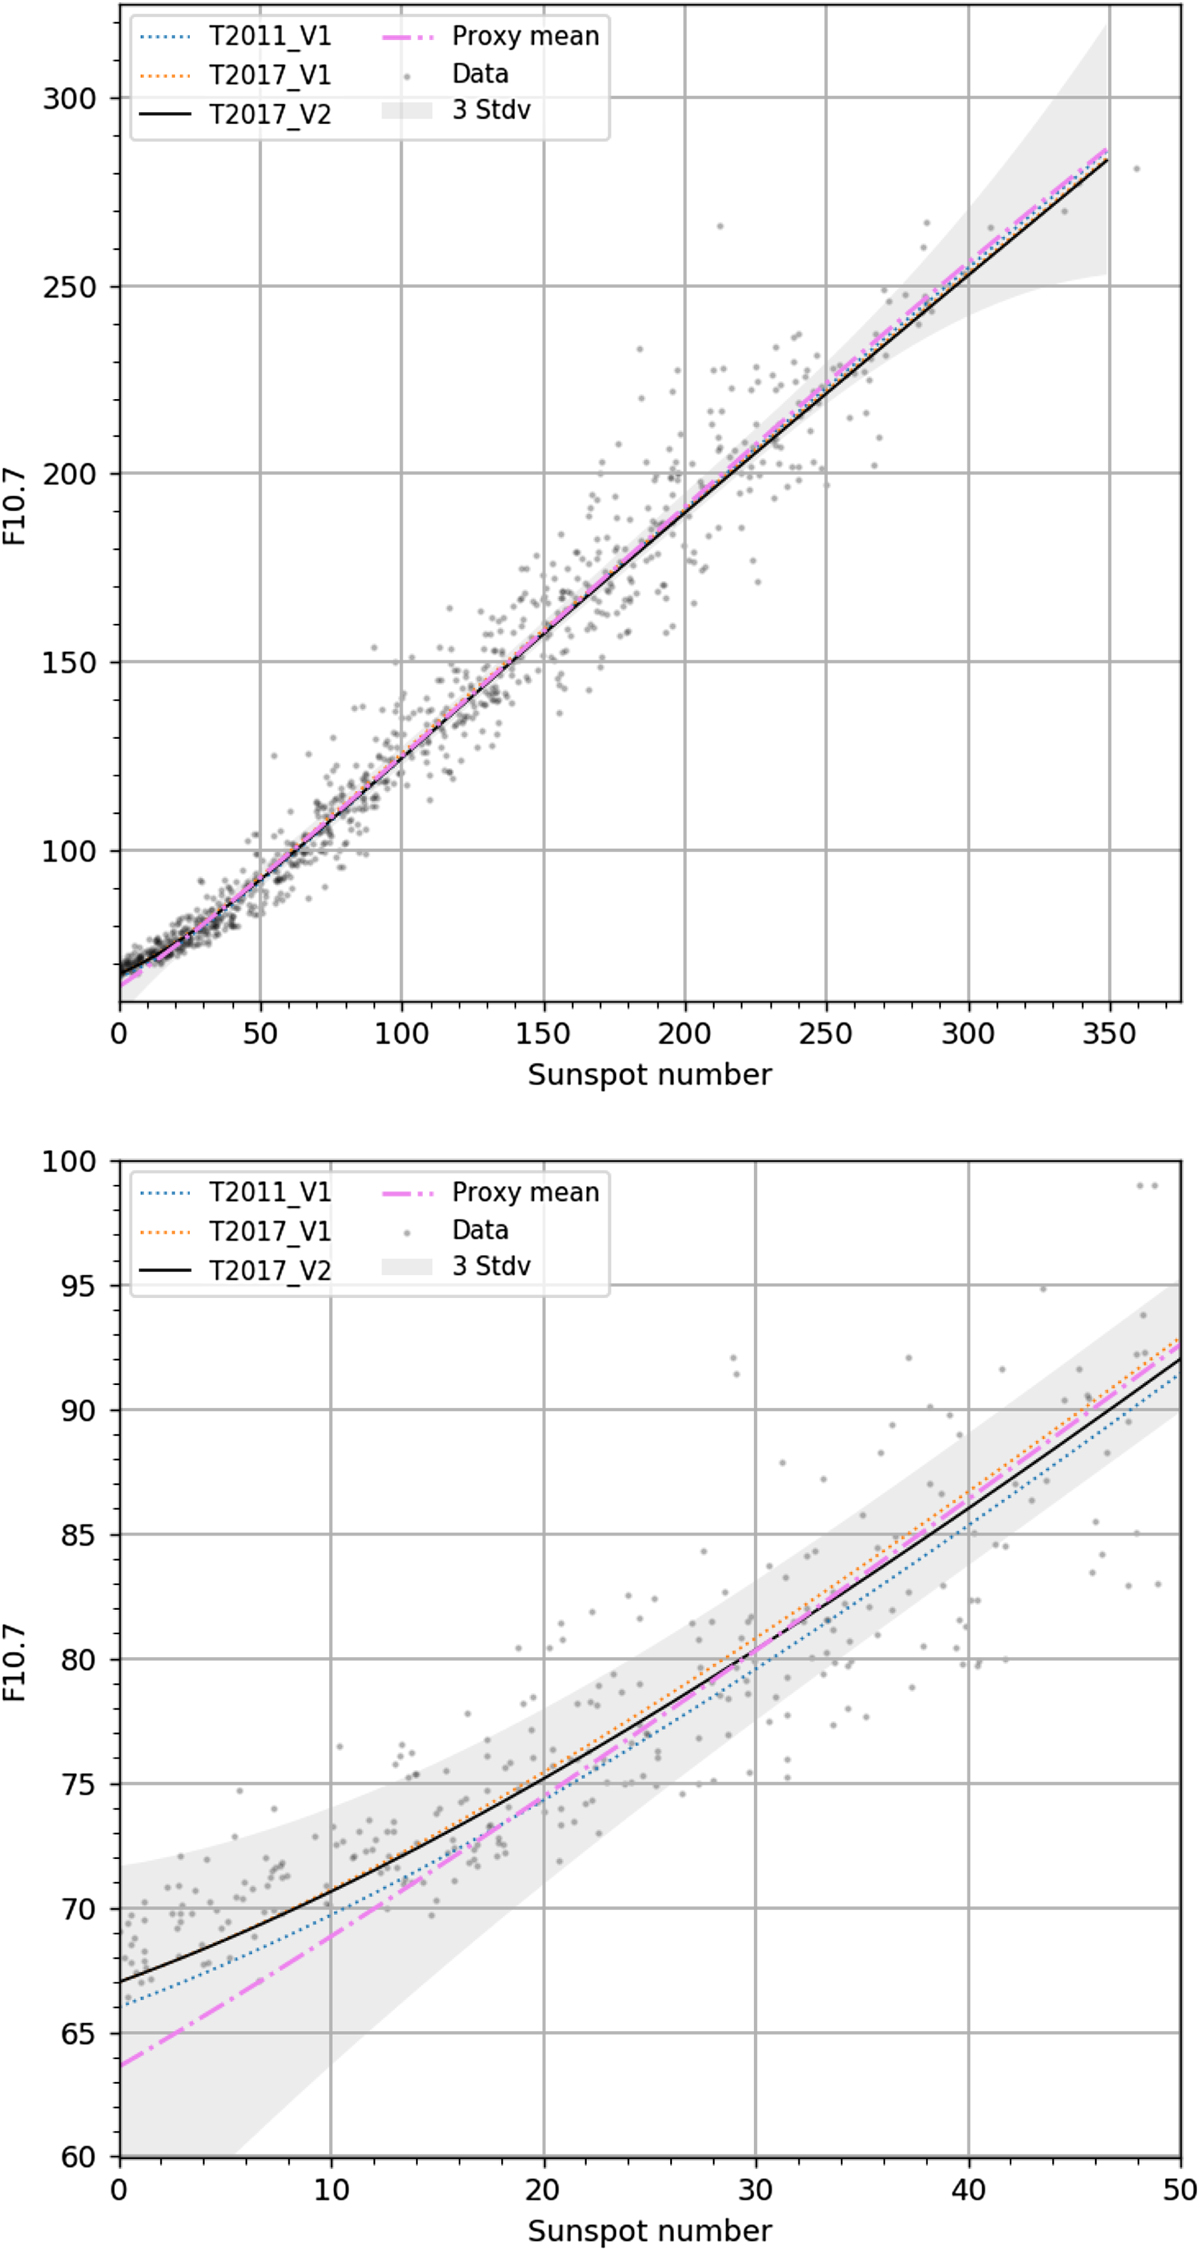
Mean (purple dash-dotted curve) and standard deviation of all proxies in Figure 1 (gray shading). Three recent proxies by Tapping et al. (cf. Table 1) are also included, as well as the observed monthly mean values (gray dots). The lower plot is a zoomed-in view of the upper plot for low activity levels.
Current usage metrics show cumulative count of Article Views (full-text article views including HTML views, PDF and ePub downloads, according to the available data) and Abstracts Views on Vision4Press platform.
Data correspond to usage on the plateform after 2015. The current usage metrics is available 48-96 hours after online publication and is updated daily on week days.
Initial download of the metrics may take a while.