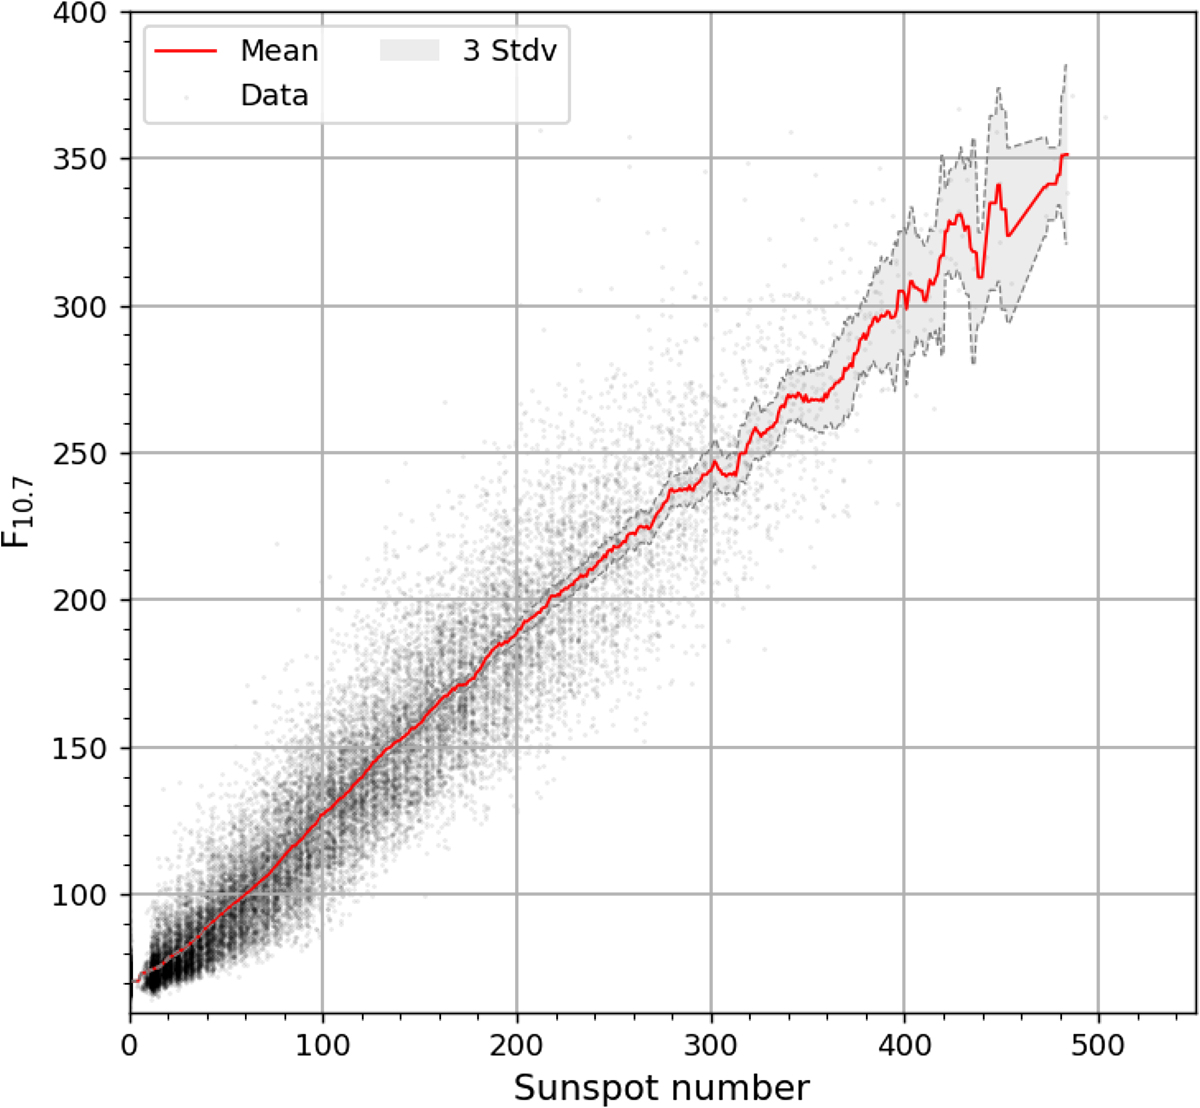
Fig. 4
Download original image
Mean non-parametric profile (red line) with 3-σm range (gray shading), obtained by averaging all daily F10.7 values for SN within a narrow band centered on the SN in the bottom axis (see details in the main text). Gray dots are the daily observed values. The number of data points strongly decreases above SN = 300 and F10.7 = 250 sfu, leading to a much larger SEM σm.
Current usage metrics show cumulative count of Article Views (full-text article views including HTML views, PDF and ePub downloads, according to the available data) and Abstracts Views on Vision4Press platform.
Data correspond to usage on the plateform after 2015. The current usage metrics is available 48-96 hours after online publication and is updated daily on week days.
Initial download of the metrics may take a while.