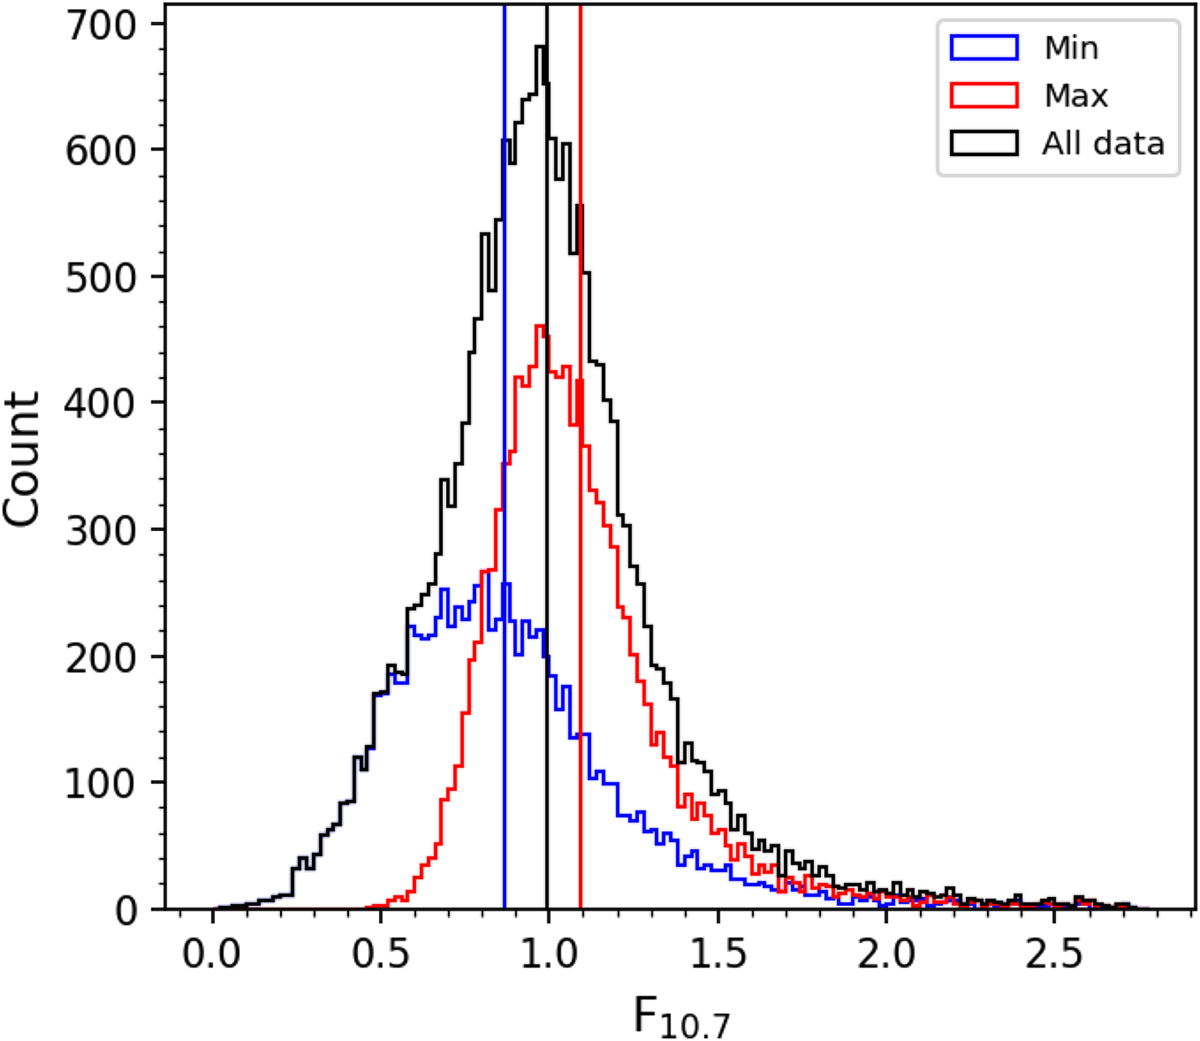
Fig. 7
Download original image
Histogram of the ratio between daily F10.7 data and the mean F10.7 value (after subtraction of a 67 sfu base quiet-Sun flux), for all data with SN > 15. The black curve is for the entire data series, while the blue and red histograms are respectively for the maxima of the solar cycles (time of maximum −2 to +3 years) and the minima (the rest of the data). The distributions are slightly asymmetrical with a longer upper wing. The means of the distributions are indicated by thick vertical lines, with the matching colors. The standard deviation of the distributions equals 35%, while the SEM equals 0.5% (based on more than 10,000 daily ratios in each distribution). The distributions for cycle maxima and minima are significantly shifted by 12% above and below the global mean.
Current usage metrics show cumulative count of Article Views (full-text article views including HTML views, PDF and ePub downloads, according to the available data) and Abstracts Views on Vision4Press platform.
Data correspond to usage on the plateform after 2015. The current usage metrics is available 48-96 hours after online publication and is updated daily on week days.
Initial download of the metrics may take a while.