Fig. 11
Download original image
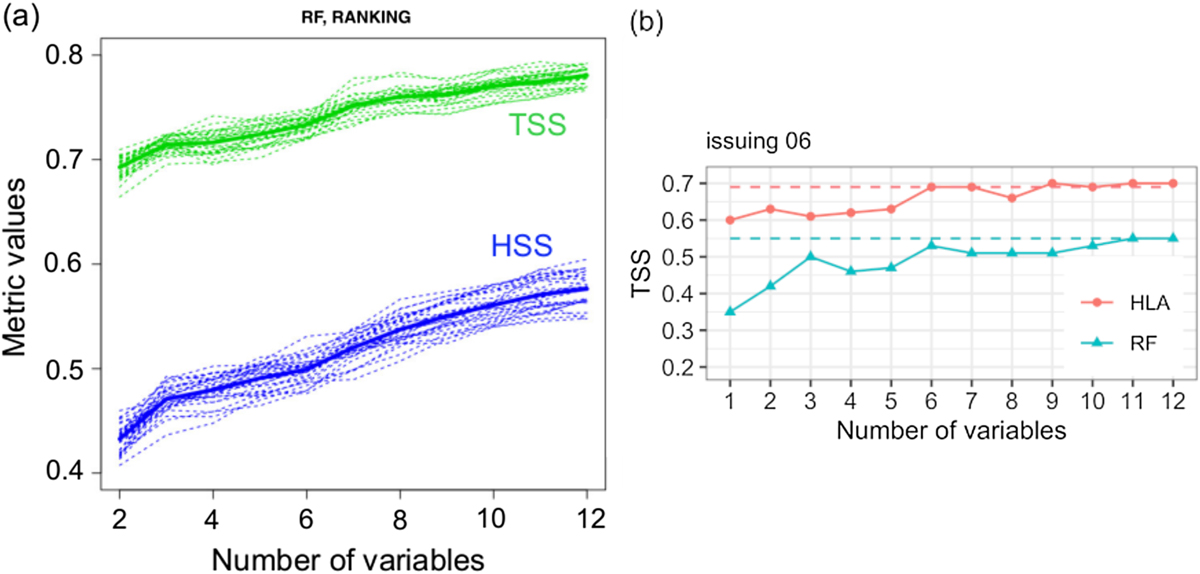
Example prediction runs adapted from (a) Florios et al. (2018) and (b) Campi et al. (2019) for the same basic prediction settings, namely a 24-hr forecast window for GOES ≥M1.0 flares. Both TSS and HSS values are shown in a using RFs only, while b shows only TSS values for two different methods, namely hybrid LASSO (HLA) and RF. The abscissas in both plots correspond to the number of predictors used.
Current usage metrics show cumulative count of Article Views (full-text article views including HTML views, PDF and ePub downloads, according to the available data) and Abstracts Views on Vision4Press platform.
Data correspond to usage on the plateform after 2015. The current usage metrics is available 48-96 hours after online publication and is updated daily on week days.
Initial download of the metrics may take a while.