Fig. 3
Download original image
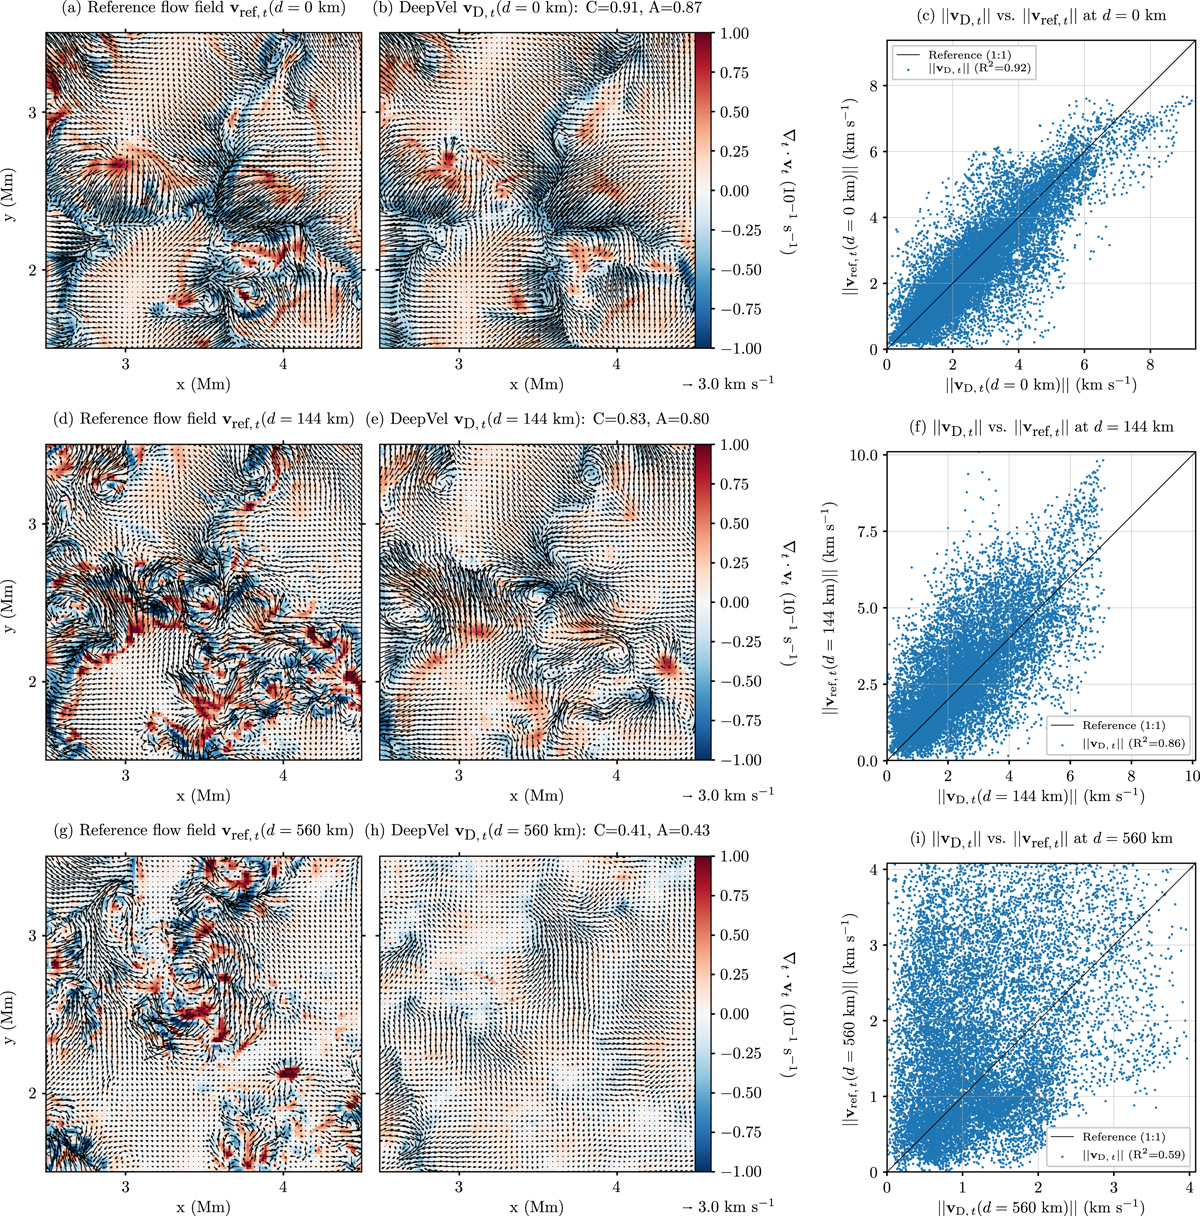
Below the surface velocity inversions, MURaM-QS dataset. Patches of 125 by 125 pixels2 extracted from instantaneous transverse velocity field maps which were computed at geometrical depths (top) d = 0 km, (middle) d = 144 km, (bottom) d = 560 km by (left column) the MURaM-QS simulation (Vögler et al., 2005) and (middle column) single-layer output versions of DeepVel. The divergence of the transverse plasma motions (i.e., ∇t·vt) is displayed as colored background to emphasize the complexity of the structures that arise at increasing depths. (Right column) Scatterplots comparing amplitudes ||vD,t|| to ||vref,t|| at each geometrical depth. The black line represents the expected solution (i.e., a coefficient of determination R2 = 1).
Current usage metrics show cumulative count of Article Views (full-text article views including HTML views, PDF and ePub downloads, according to the available data) and Abstracts Views on Vision4Press platform.
Data correspond to usage on the plateform after 2015. The current usage metrics is available 48-96 hours after online publication and is updated daily on week days.
Initial download of the metrics may take a while.