Fig. 9
Download original image
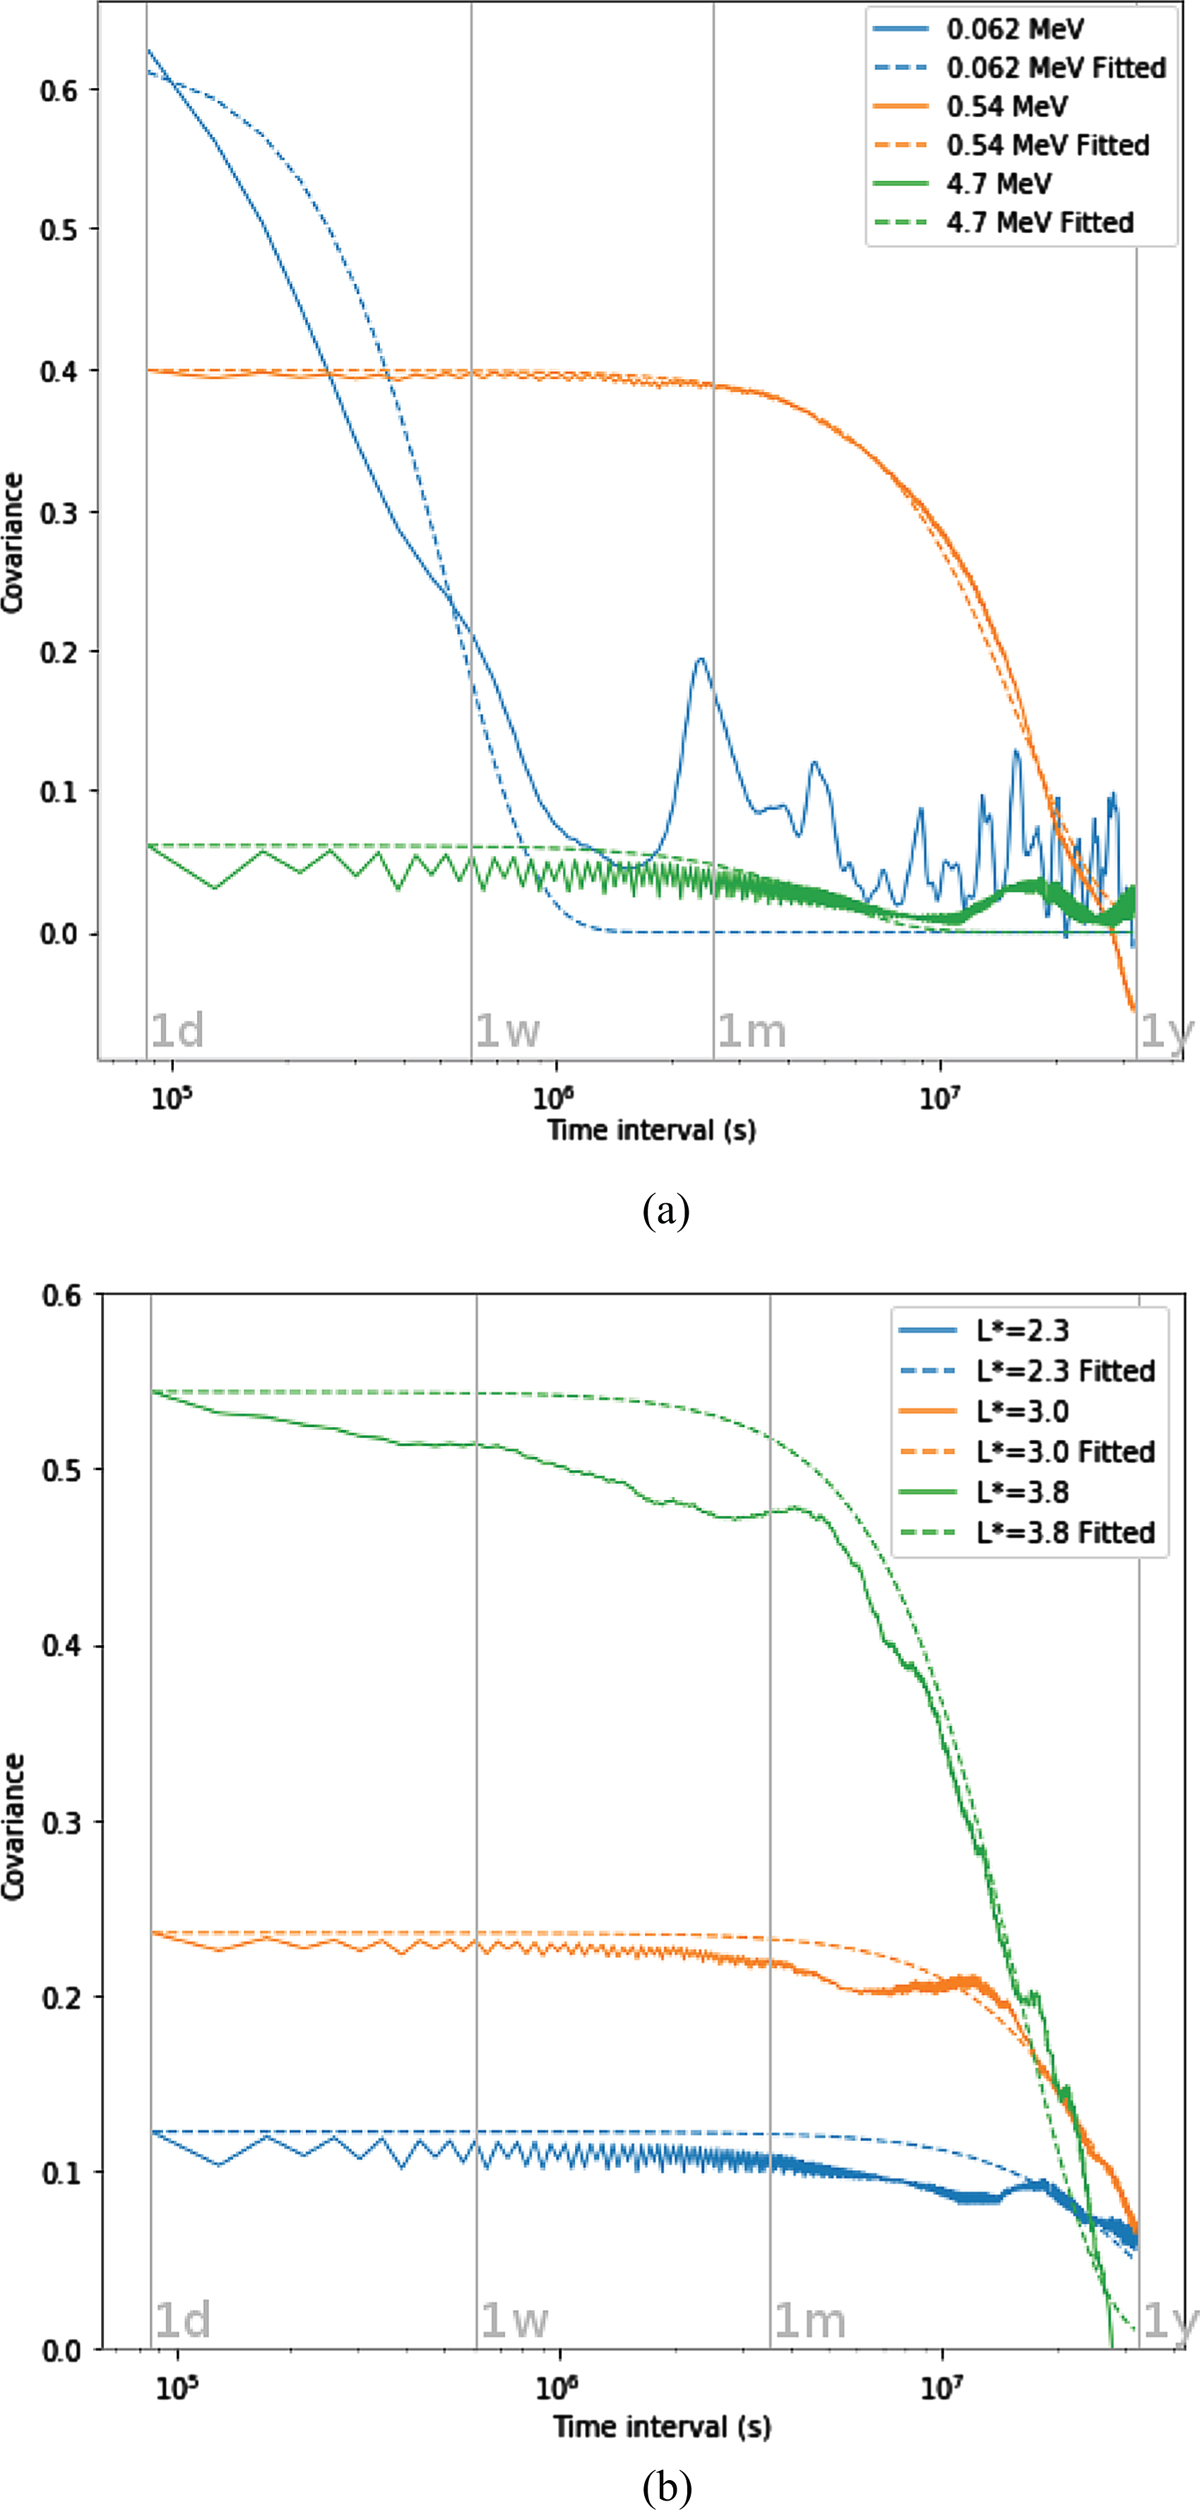
Temporal covariances of the proton flux measured and fitted. Vertical gray lines present the 1 day, 1 week, 1 month and 1 year time intervals. (a) Points at the magnetic equator and for L* values with maximal mean fluxes for each energy (62 keV in blue, 539 in orange and 4.71 MeV in green). (b) Points at the magnetic equator and for L* values 2.3 (in blue), 3.0 (in orange) and 3.8 (in green).
Current usage metrics show cumulative count of Article Views (full-text article views including HTML views, PDF and ePub downloads, according to the available data) and Abstracts Views on Vision4Press platform.
Data correspond to usage on the plateform after 2015. The current usage metrics is available 48-96 hours after online publication and is updated daily on week days.
Initial download of the metrics may take a while.