Open Access
Fig. 8
Download original image
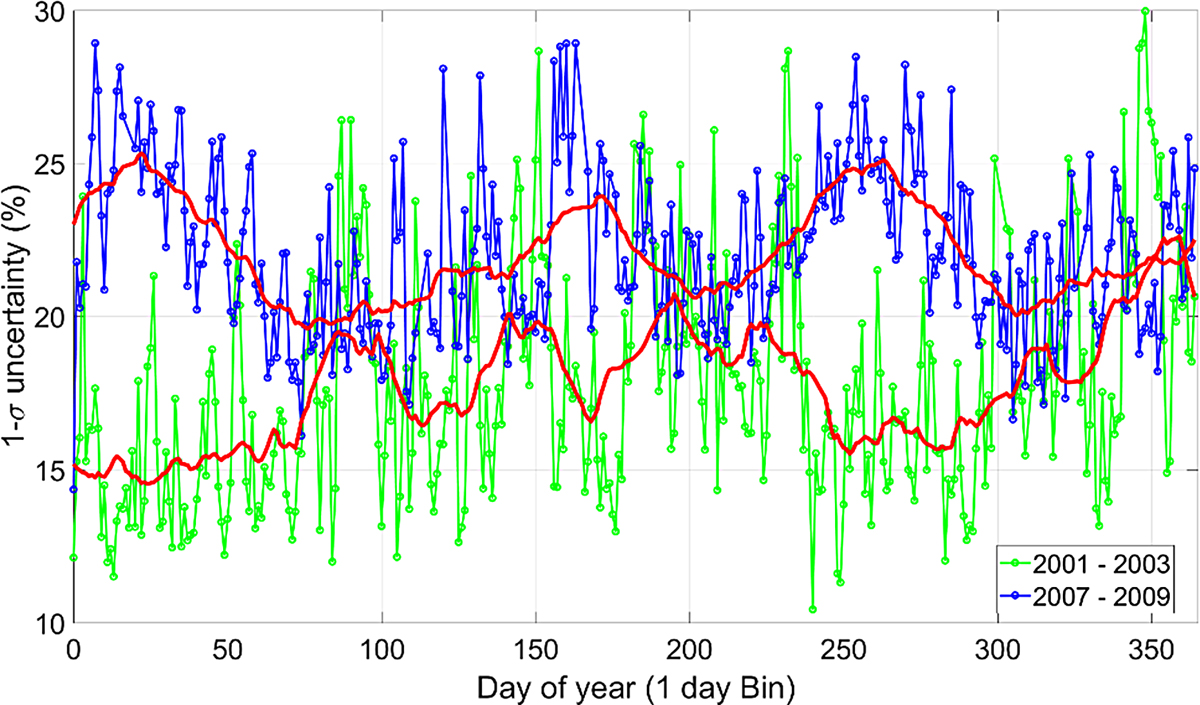
Density ratios 1-σ uncertainty binned in the day of the year of DTM2020 with a 27-day averaged in red color, for two periods (2001–2003 and 2007–2009, respectively maximum and minimum of solar cycle 23).
Current usage metrics show cumulative count of Article Views (full-text article views including HTML views, PDF and ePub downloads, according to the available data) and Abstracts Views on Vision4Press platform.
Data correspond to usage on the plateform after 2015. The current usage metrics is available 48-96 hours after online publication and is updated daily on week days.
Initial download of the metrics may take a while.