Fig. 8
Download original image
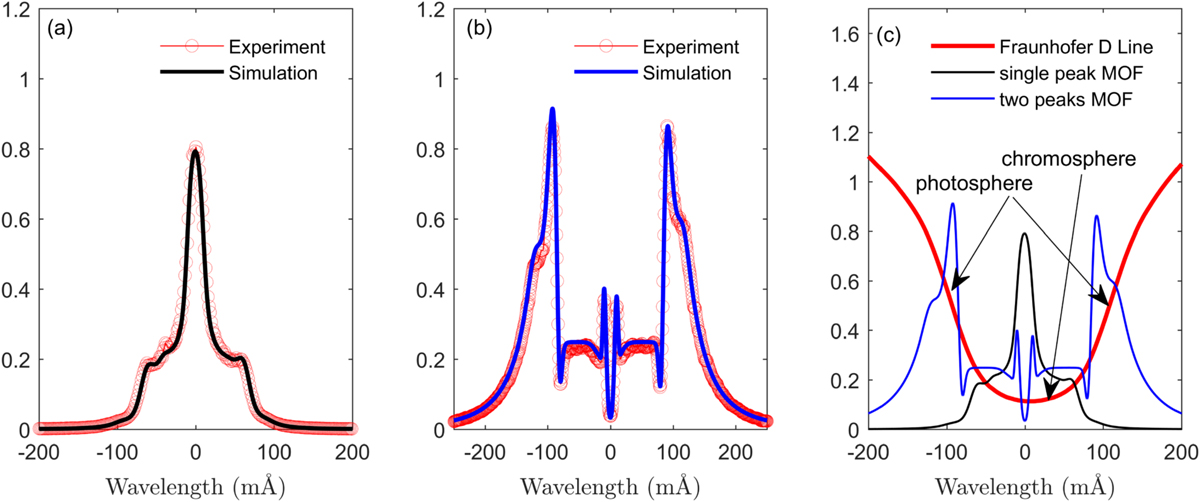
The simulation and experiment results of the sodium MOF transmission functions. (a) and (b) show the transmission functions of Na D MOF with a center peak and with two wing peaks, respectively. Panel (c) shows the sodium MOF filter that has a single peak in the Fraunhofer D2 line center, enabling chromospheric filtering. The red solid line is the Fraunhofer line and the blue and black solid line are the MOF transmission functions.
Current usage metrics show cumulative count of Article Views (full-text article views including HTML views, PDF and ePub downloads, according to the available data) and Abstracts Views on Vision4Press platform.
Data correspond to usage on the plateform after 2015. The current usage metrics is available 48-96 hours after online publication and is updated daily on week days.
Initial download of the metrics may take a while.