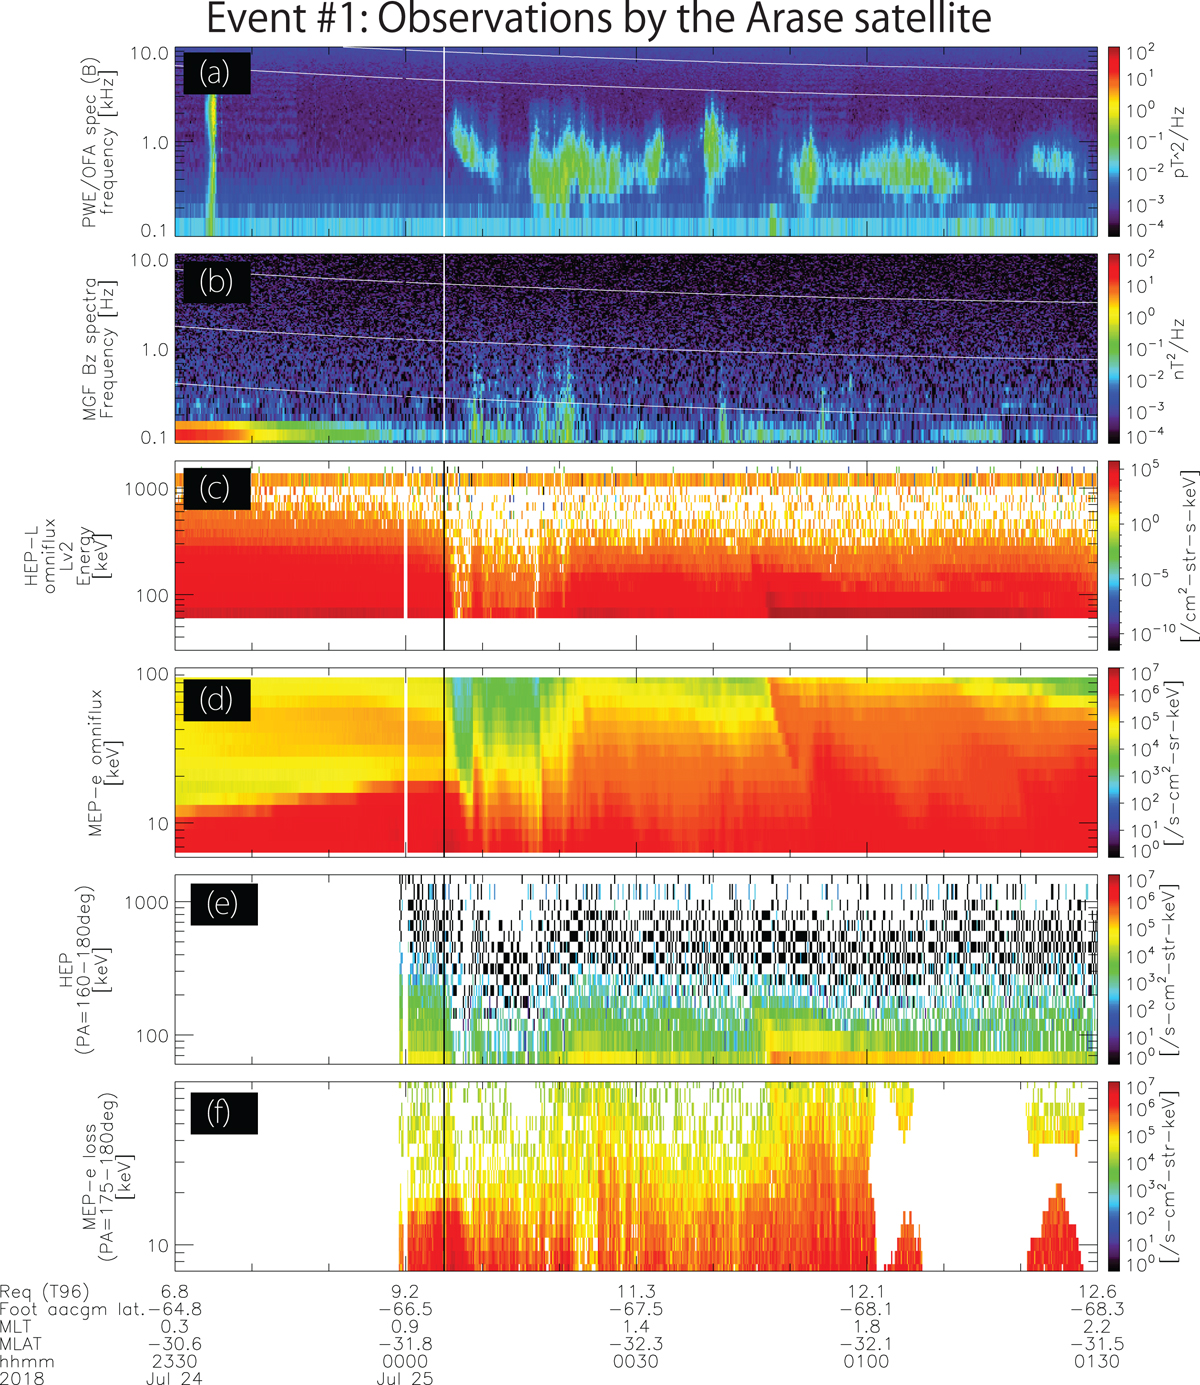
Figure 4

Download original image
In-situ observation of plasma waves and energetic electrons at the Arase satellite for the same time period as shown in Figure 3. The vertical solid line at 0005 UT indicates the onset of the substorm. The top two panels show frequency-time spectra of the wave magnetic field measured by (a) PWE-OFA and (b) MGF. The solid white curves in (a) represent fce and 0.5 fce, respectively, where fce is the local electron cyclotron frequency. The white curves in (b) represent the O+, He+, and H+ cyclotron frequencies, respectively, as calculated from the local magnetic field measured by MGF. Energy-time spectra of the omnidirectional electron fluxes observed by (c) HEP-L and (d) MEP-e are shown in the middle. The pitch-angle resolved fluxes as measured by (e) HEP-L and (f) MEP-e are also shown. The loss-cone angle was calculated to be 4.9° at the Arase satellite position at 0005 UT. The labels “Req (T96)” and “Foot aacgm lat” represent the geocentric distance of the magnetic equator and AACGM latitude of the footprints in the southern hemisphere, respectively, both traced from the position of the Arase satellite using the T96 model.
Current usage metrics show cumulative count of Article Views (full-text article views including HTML views, PDF and ePub downloads, according to the available data) and Abstracts Views on Vision4Press platform.
Data correspond to usage on the plateform after 2015. The current usage metrics is available 48-96 hours after online publication and is updated daily on week days.
Initial download of the metrics may take a while.


