Figure 5
Download original image
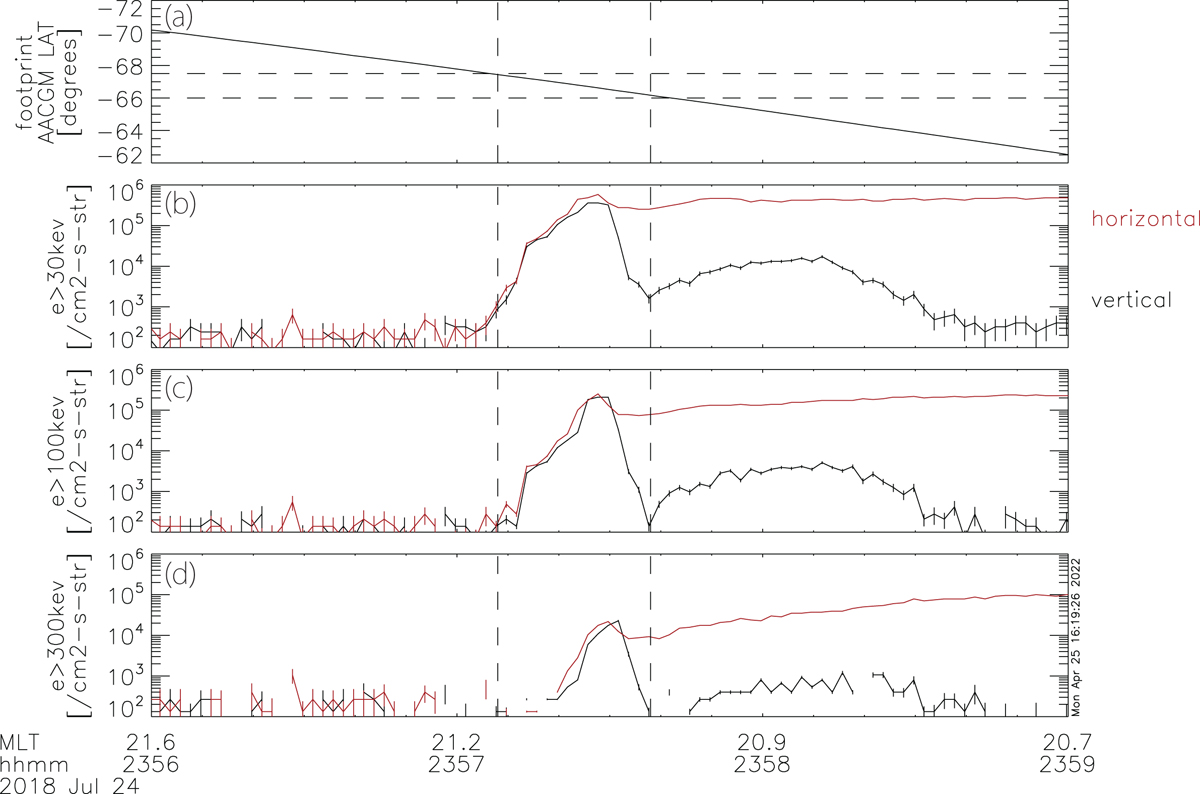
POES-15 observational data for 3 min from 2356 UT on July 24, 2018. (a) Magnetic latitude of the footprint. Integrated number fluxes of electrons in the energy range of (b) >30 keV, (c) >100 keV, and (d) >300 keV. Black and red lines represent vertical and horizontal electron fluxes, respectively. Vertical dashed lines mark 2357:07 UT and 2357:37UT.
Current usage metrics show cumulative count of Article Views (full-text article views including HTML views, PDF and ePub downloads, according to the available data) and Abstracts Views on Vision4Press platform.
Data correspond to usage on the plateform after 2015. The current usage metrics is available 48-96 hours after online publication and is updated daily on week days.
Initial download of the metrics may take a while.