Figure 7

Download original image
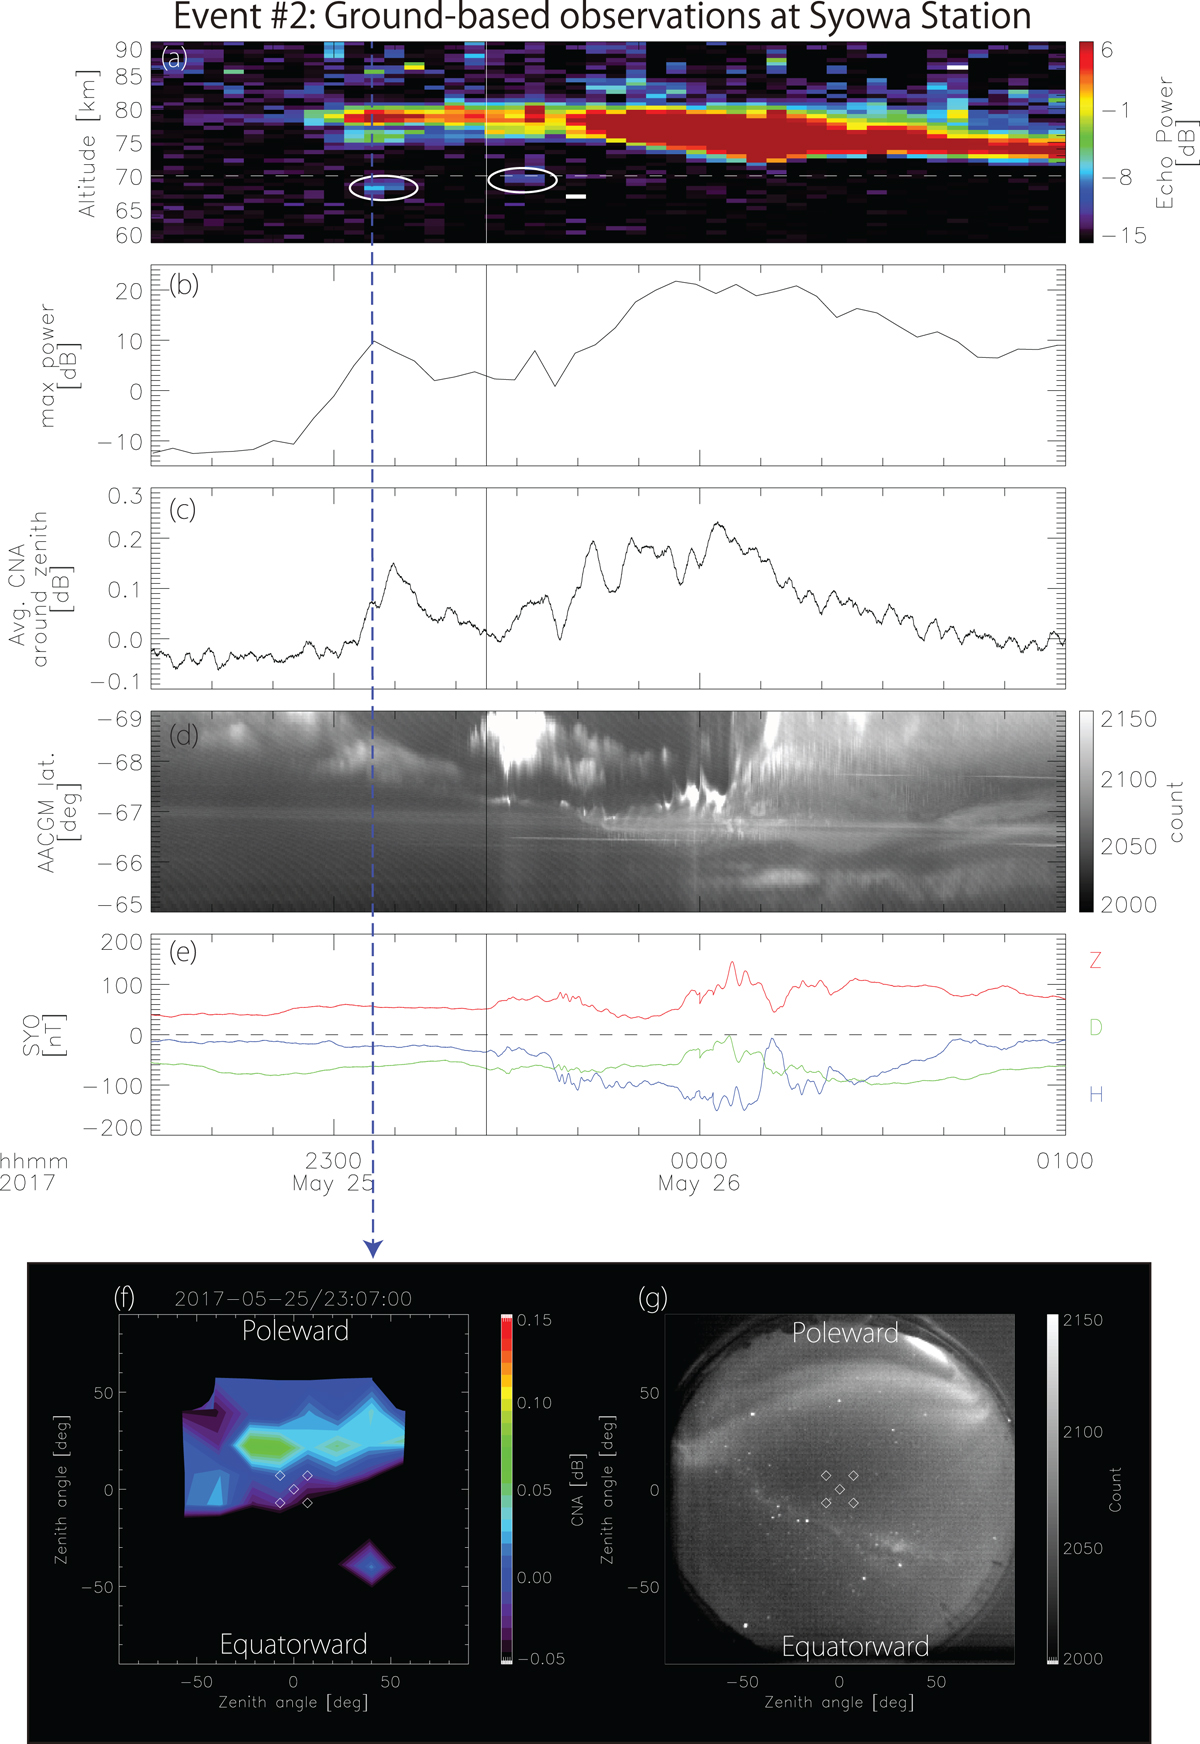
Ground-based observations at Syowa Station of Event #2 for a 2.5-hour period from 2230 UT on May 25, 2017. Top panels (a)–(e) are shown in the same format as Figure 3. The vertical line at 2325 UT indicates the beginning of the expansion phase of the substorm. The bottom panels show the all-sky maps of (f) CNA and (g) aurora from the ground view at 2307 UT, as indicated by the blue dotted line. The white diamonds represent the beam directions of the PANSY radar.
Current usage metrics show cumulative count of Article Views (full-text article views including HTML views, PDF and ePub downloads, according to the available data) and Abstracts Views on Vision4Press platform.
Data correspond to usage on the plateform after 2015. The current usage metrics is available 48-96 hours after online publication and is updated daily on week days.
Initial download of the metrics may take a while.


