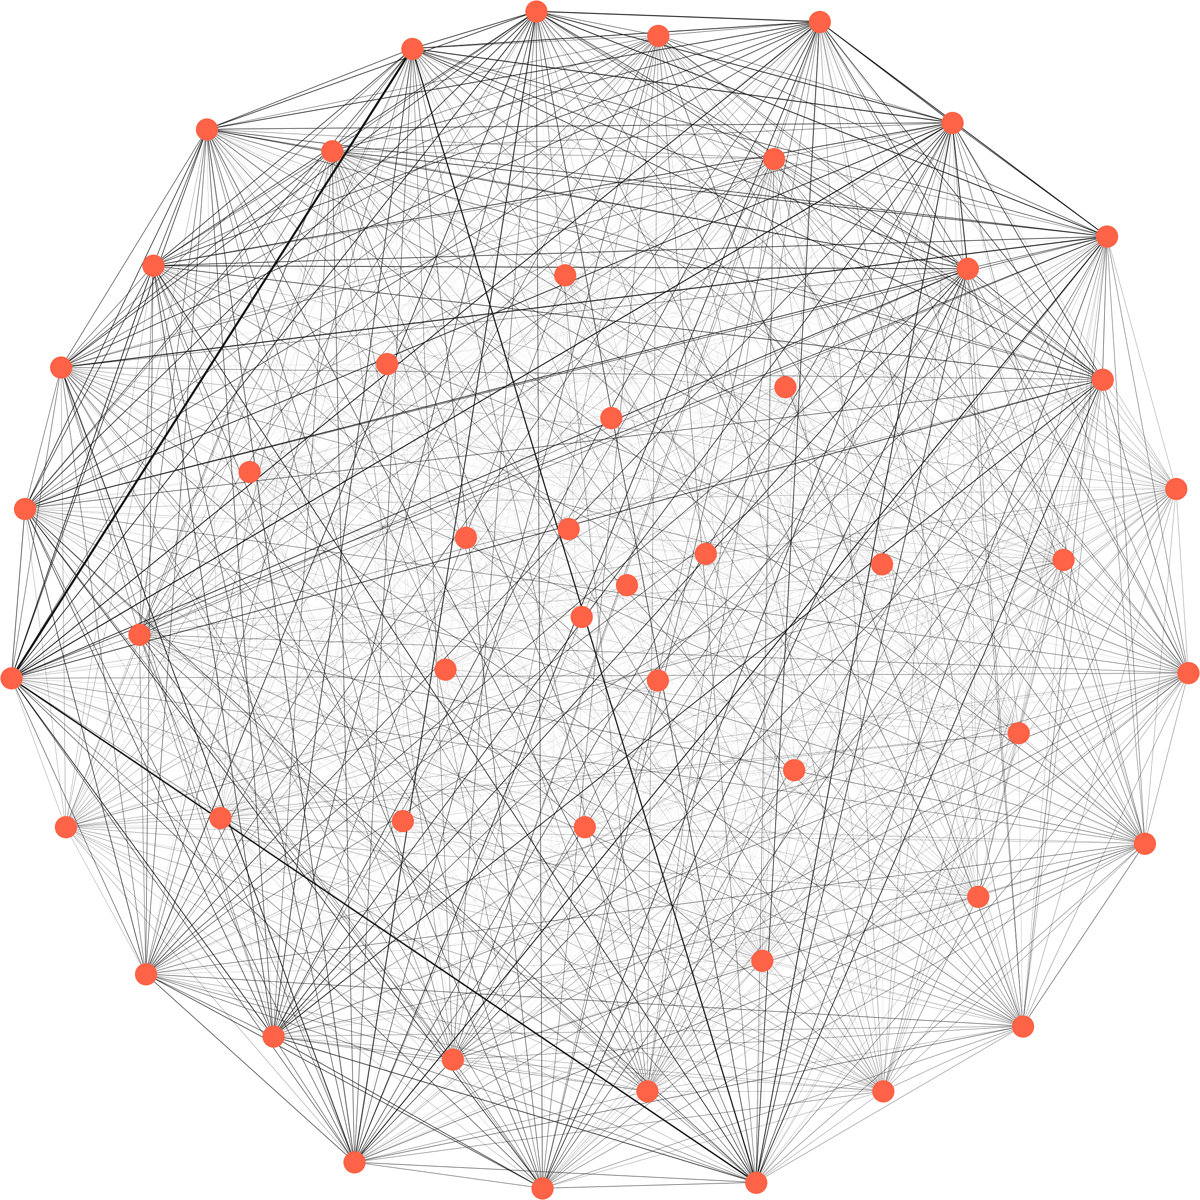
Fig. 7
Download original image
A partial representation (i.e., 50 nodes) of the fully connected graph obtained from our complete dataset (i.e., 12,172 nodes). Each node (red dot) represents an sTEC profile, and the edges of different widths represent the similarity between nodes, defined by the EMD distance.
Current usage metrics show cumulative count of Article Views (full-text article views including HTML views, PDF and ePub downloads, according to the available data) and Abstracts Views on Vision4Press platform.
Data correspond to usage on the plateform after 2015. The current usage metrics is available 48-96 hours after online publication and is updated daily on week days.
Initial download of the metrics may take a while.