Fig. 10
Download original image
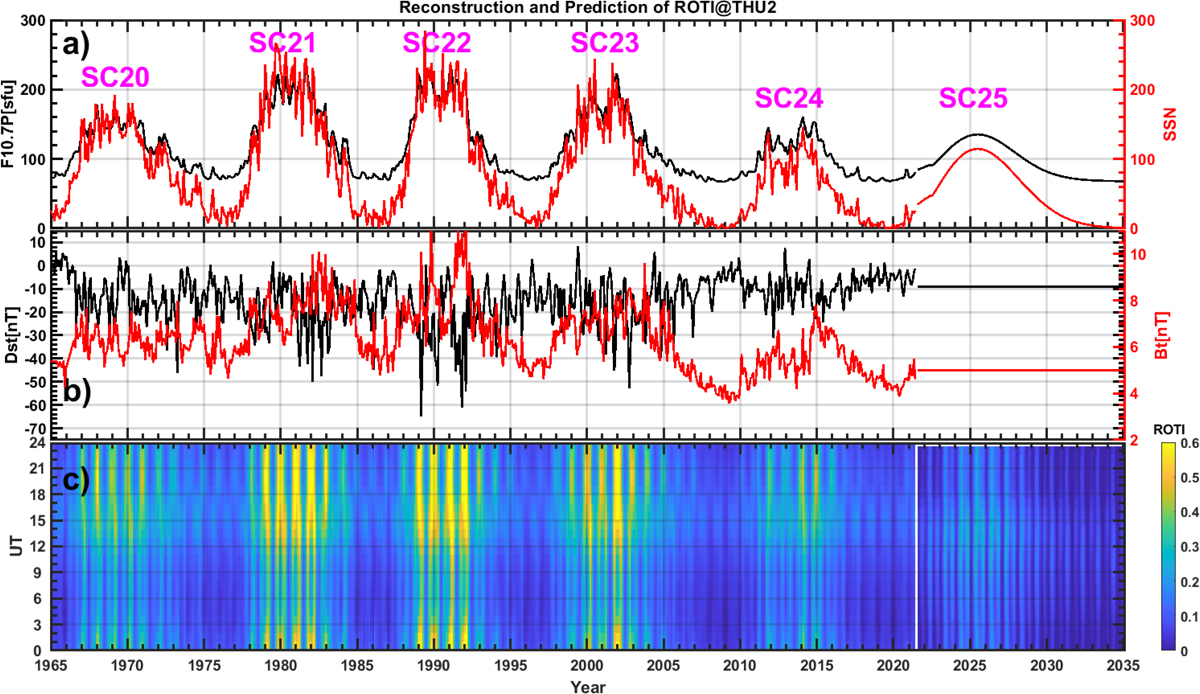
(a) The monthly averaged F10.7P index (black), sunspot number (red). (b) The monthly averaged Dst index (black) and magnetic strength of IMF (red). (c) The reconstructed ROTI climatology in bins of 1 hour in UT by 1 month from 1965 to 2035. The predicted values of F10.7P and sunspot number are plotted from August 2021 to 2035. One month (July 2021) is intentionally omitted to separate observations and predictions.
Current usage metrics show cumulative count of Article Views (full-text article views including HTML views, PDF and ePub downloads, according to the available data) and Abstracts Views on Vision4Press platform.
Data correspond to usage on the plateform after 2015. The current usage metrics is available 48-96 hours after online publication and is updated daily on week days.
Initial download of the metrics may take a while.