Fig. 5
Download original image
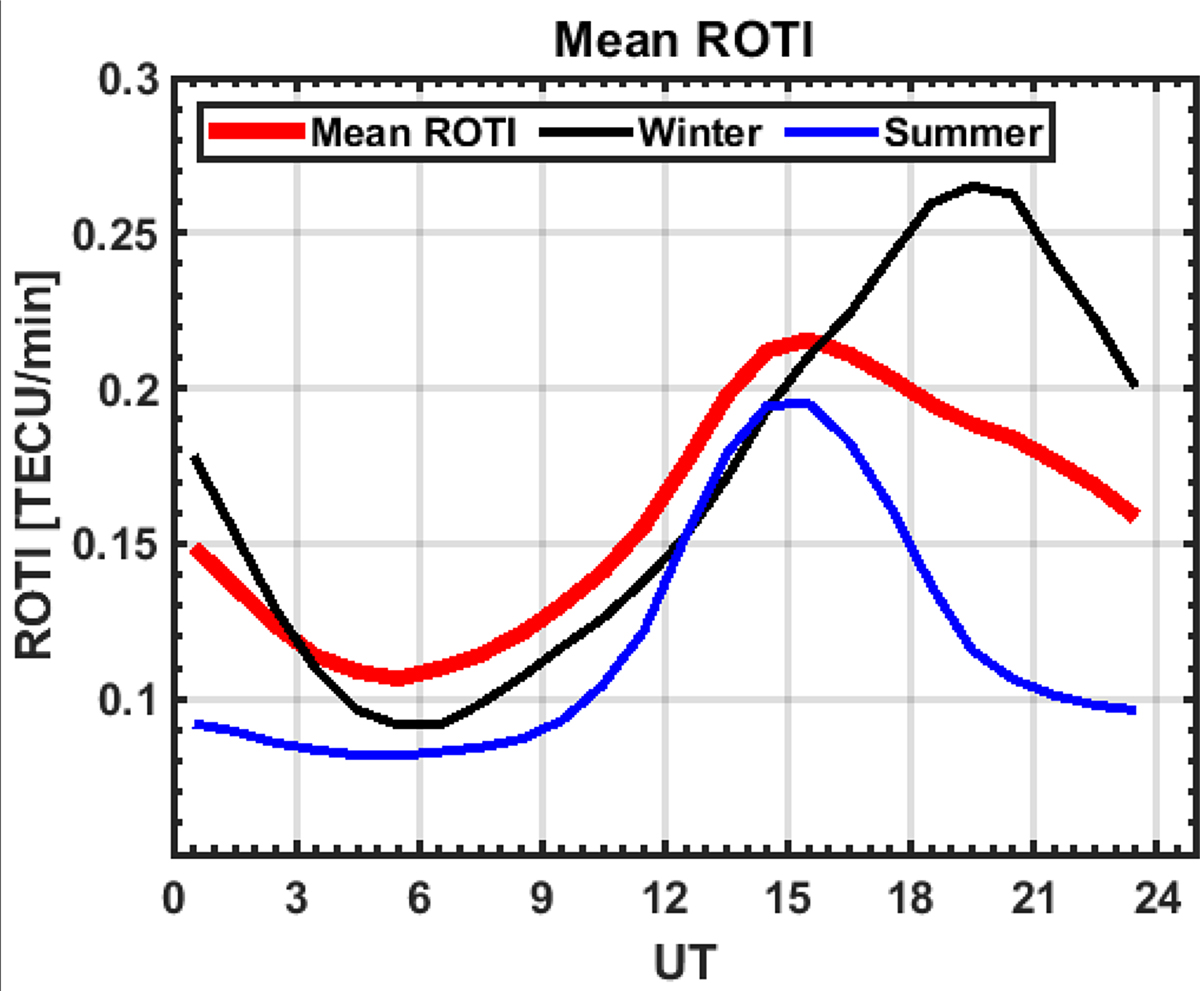
The mean of ROTI data over all winter (November, December, and January) in black and summer (May, June, and July) months in blue. The mean ROTI over all seasons is also presented as a thick red line.
Current usage metrics show cumulative count of Article Views (full-text article views including HTML views, PDF and ePub downloads, according to the available data) and Abstracts Views on Vision4Press platform.
Data correspond to usage on the plateform after 2015. The current usage metrics is available 48-96 hours after online publication and is updated daily on week days.
Initial download of the metrics may take a while.