Open Access
Fig. 12
Download original image
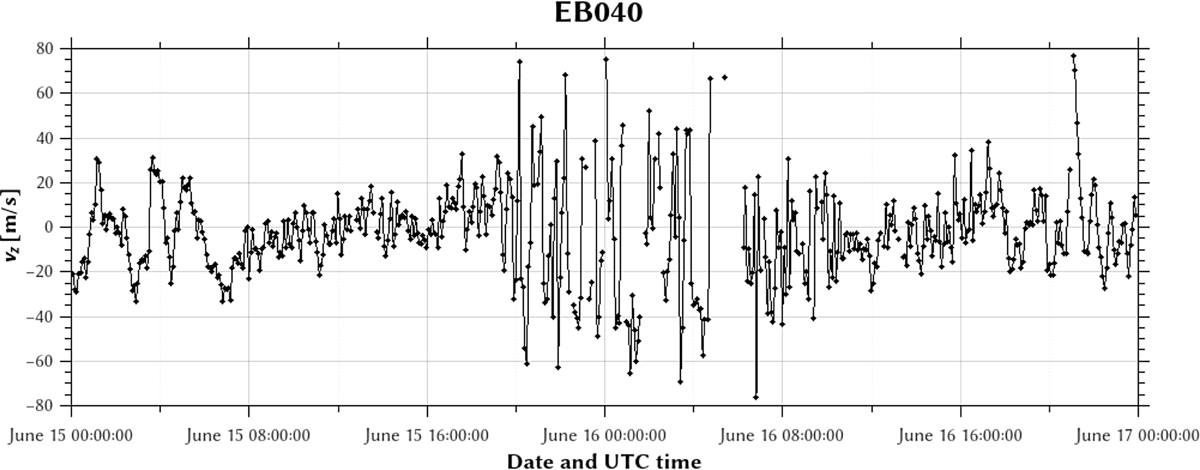
Vertical drift from the EB040 ionosonde for January 15 and 16. Similar to Figure 11, gaps in the line indicate skymaps from which no vz could be reliably obtained. Note the disturbances with long period in the early hours on January 15, likely due to large-scale TIDs of auroral origin.
Current usage metrics show cumulative count of Article Views (full-text article views including HTML views, PDF and ePub downloads, according to the available data) and Abstracts Views on Vision4Press platform.
Data correspond to usage on the plateform after 2015. The current usage metrics is available 48-96 hours after online publication and is updated daily on week days.
Initial download of the metrics may take a while.