Fig. 3
Download original image
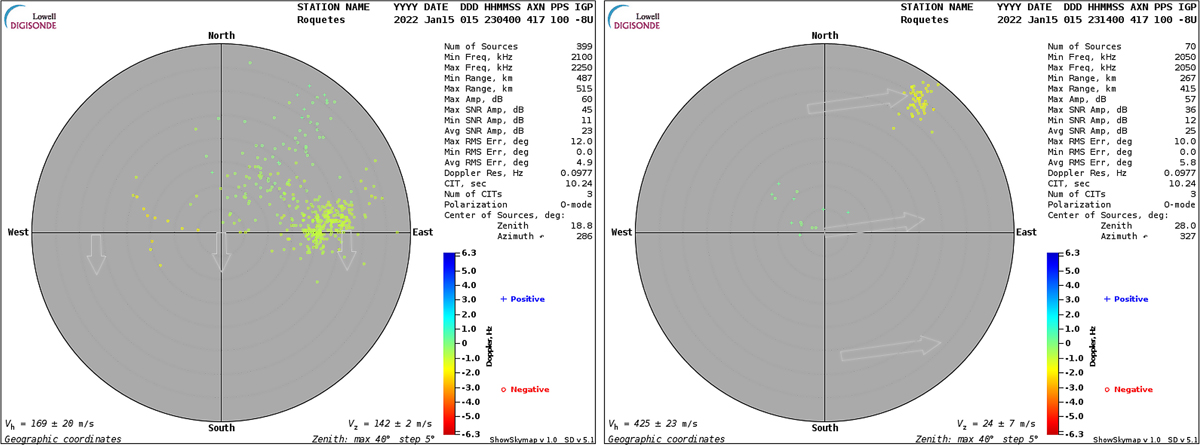
Two skymap observations from January 15 produced by the EB040 Digisonde. The left image shows the result of the sounding at 23:04 UT and the right one at 23:14 UT. Each mark represents the direction of a recorded echo, with the colour indicating the Doppler shift. The arrows drawn on the image indicate the automatically calculated bulk plasma drift.
Current usage metrics show cumulative count of Article Views (full-text article views including HTML views, PDF and ePub downloads, according to the available data) and Abstracts Views on Vision4Press platform.
Data correspond to usage on the plateform after 2015. The current usage metrics is available 48-96 hours after online publication and is updated daily on week days.
Initial download of the metrics may take a while.