Figure 14
Download original image
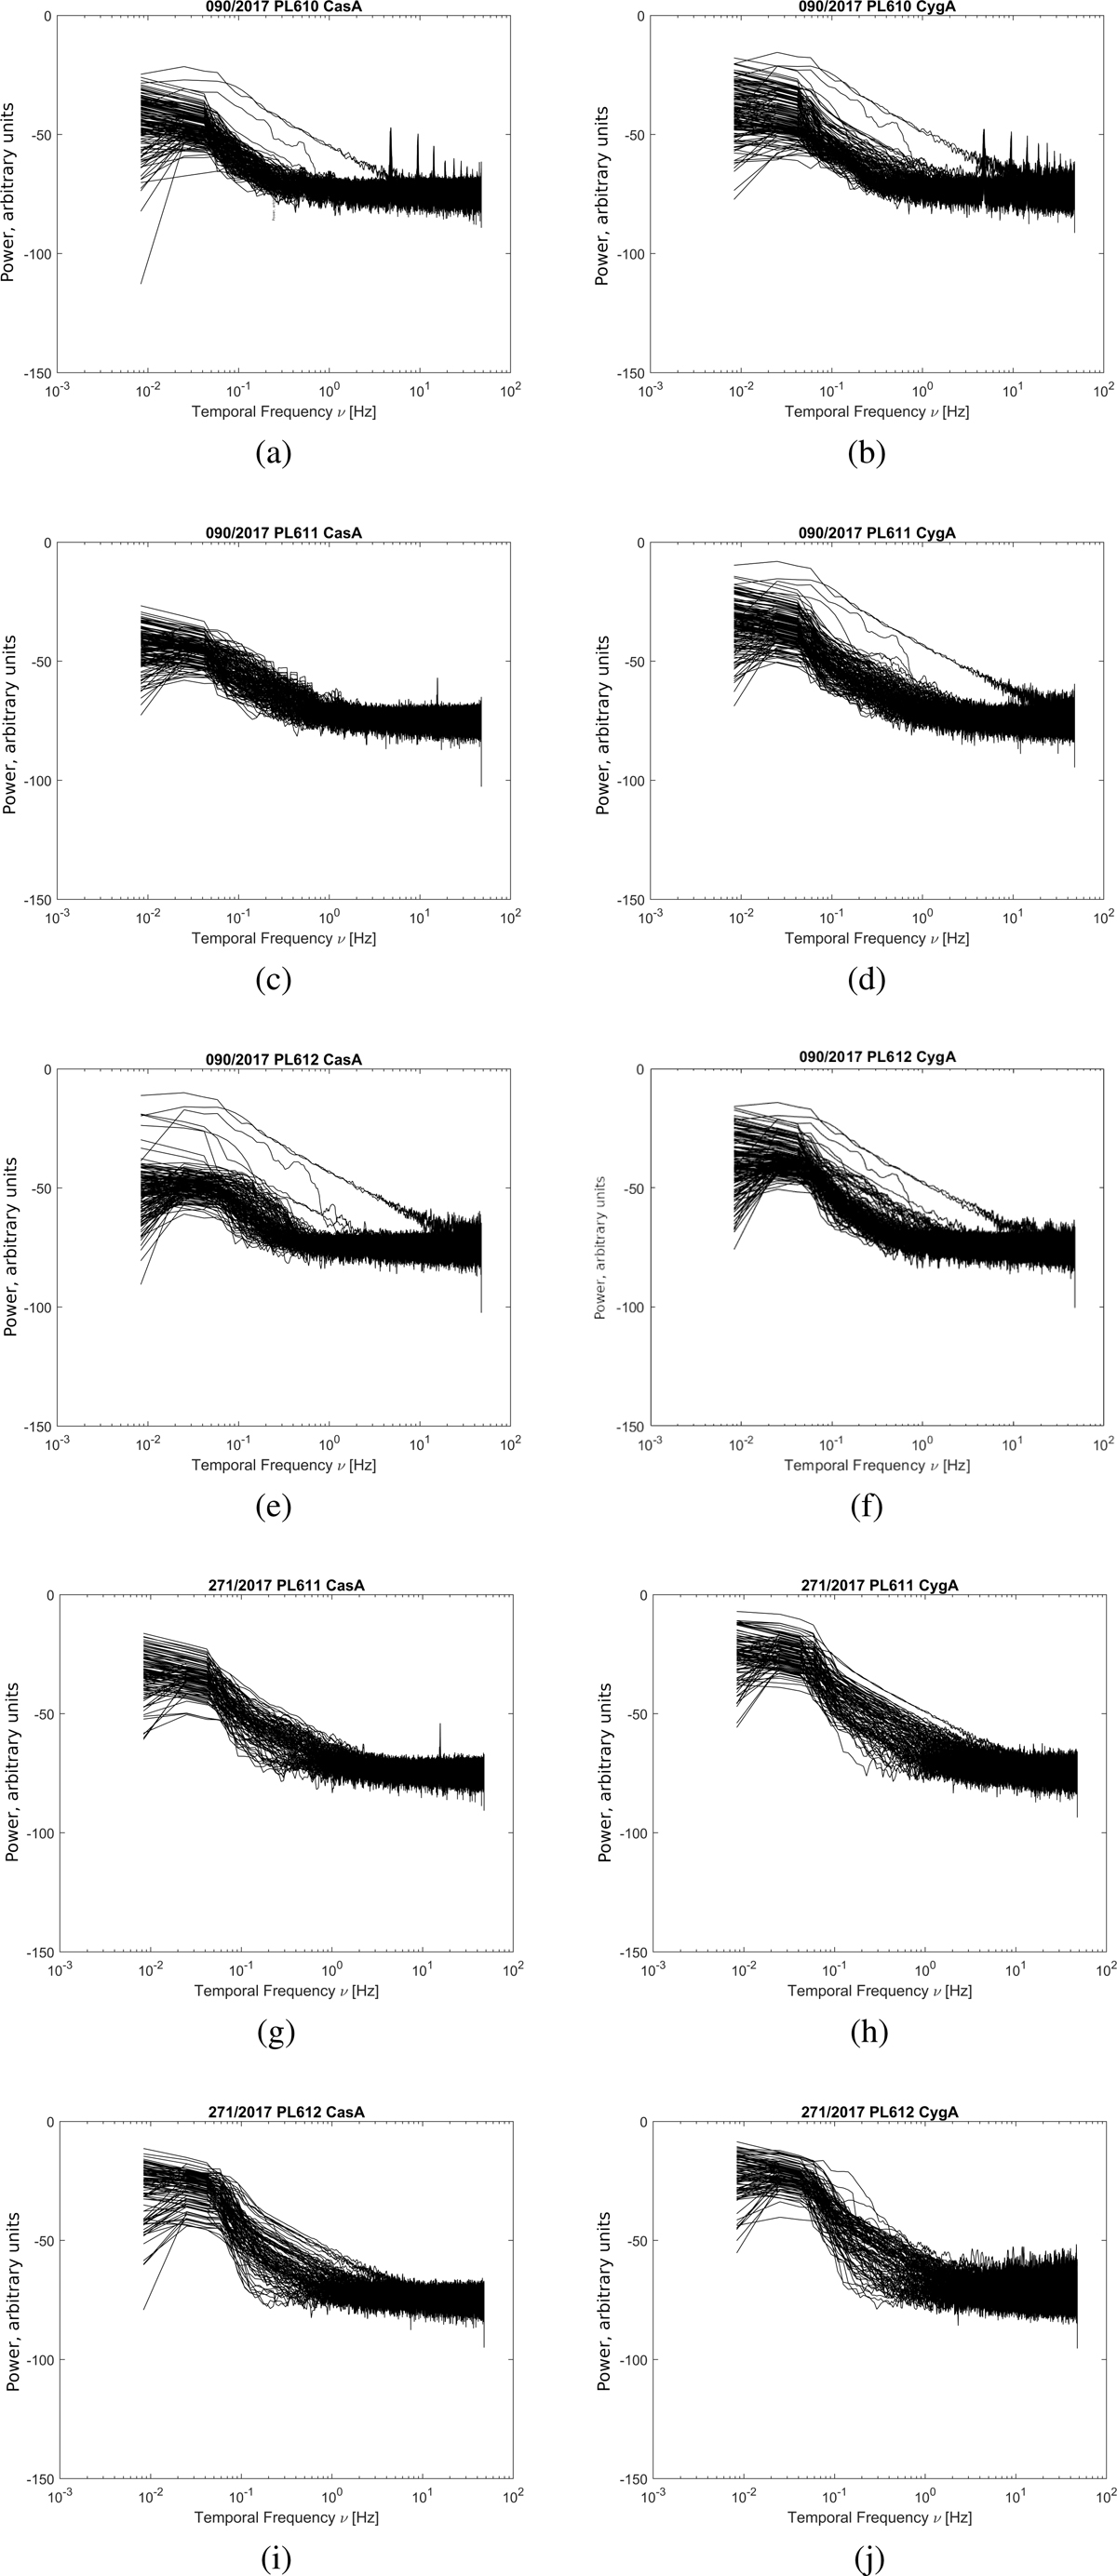
Power Spectra density plots for presented cases. Every PSD plot is made individually for every LOFAR station (PL610, PL611 and PL612) and for each target (CasA and CygA). All PSDs are calculated for middle channel.
Current usage metrics show cumulative count of Article Views (full-text article views including HTML views, PDF and ePub downloads, according to the available data) and Abstracts Views on Vision4Press platform.
Data correspond to usage on the plateform after 2015. The current usage metrics is available 48-96 hours after online publication and is updated daily on week days.
Initial download of the metrics may take a while.