Figure 8
Download original image
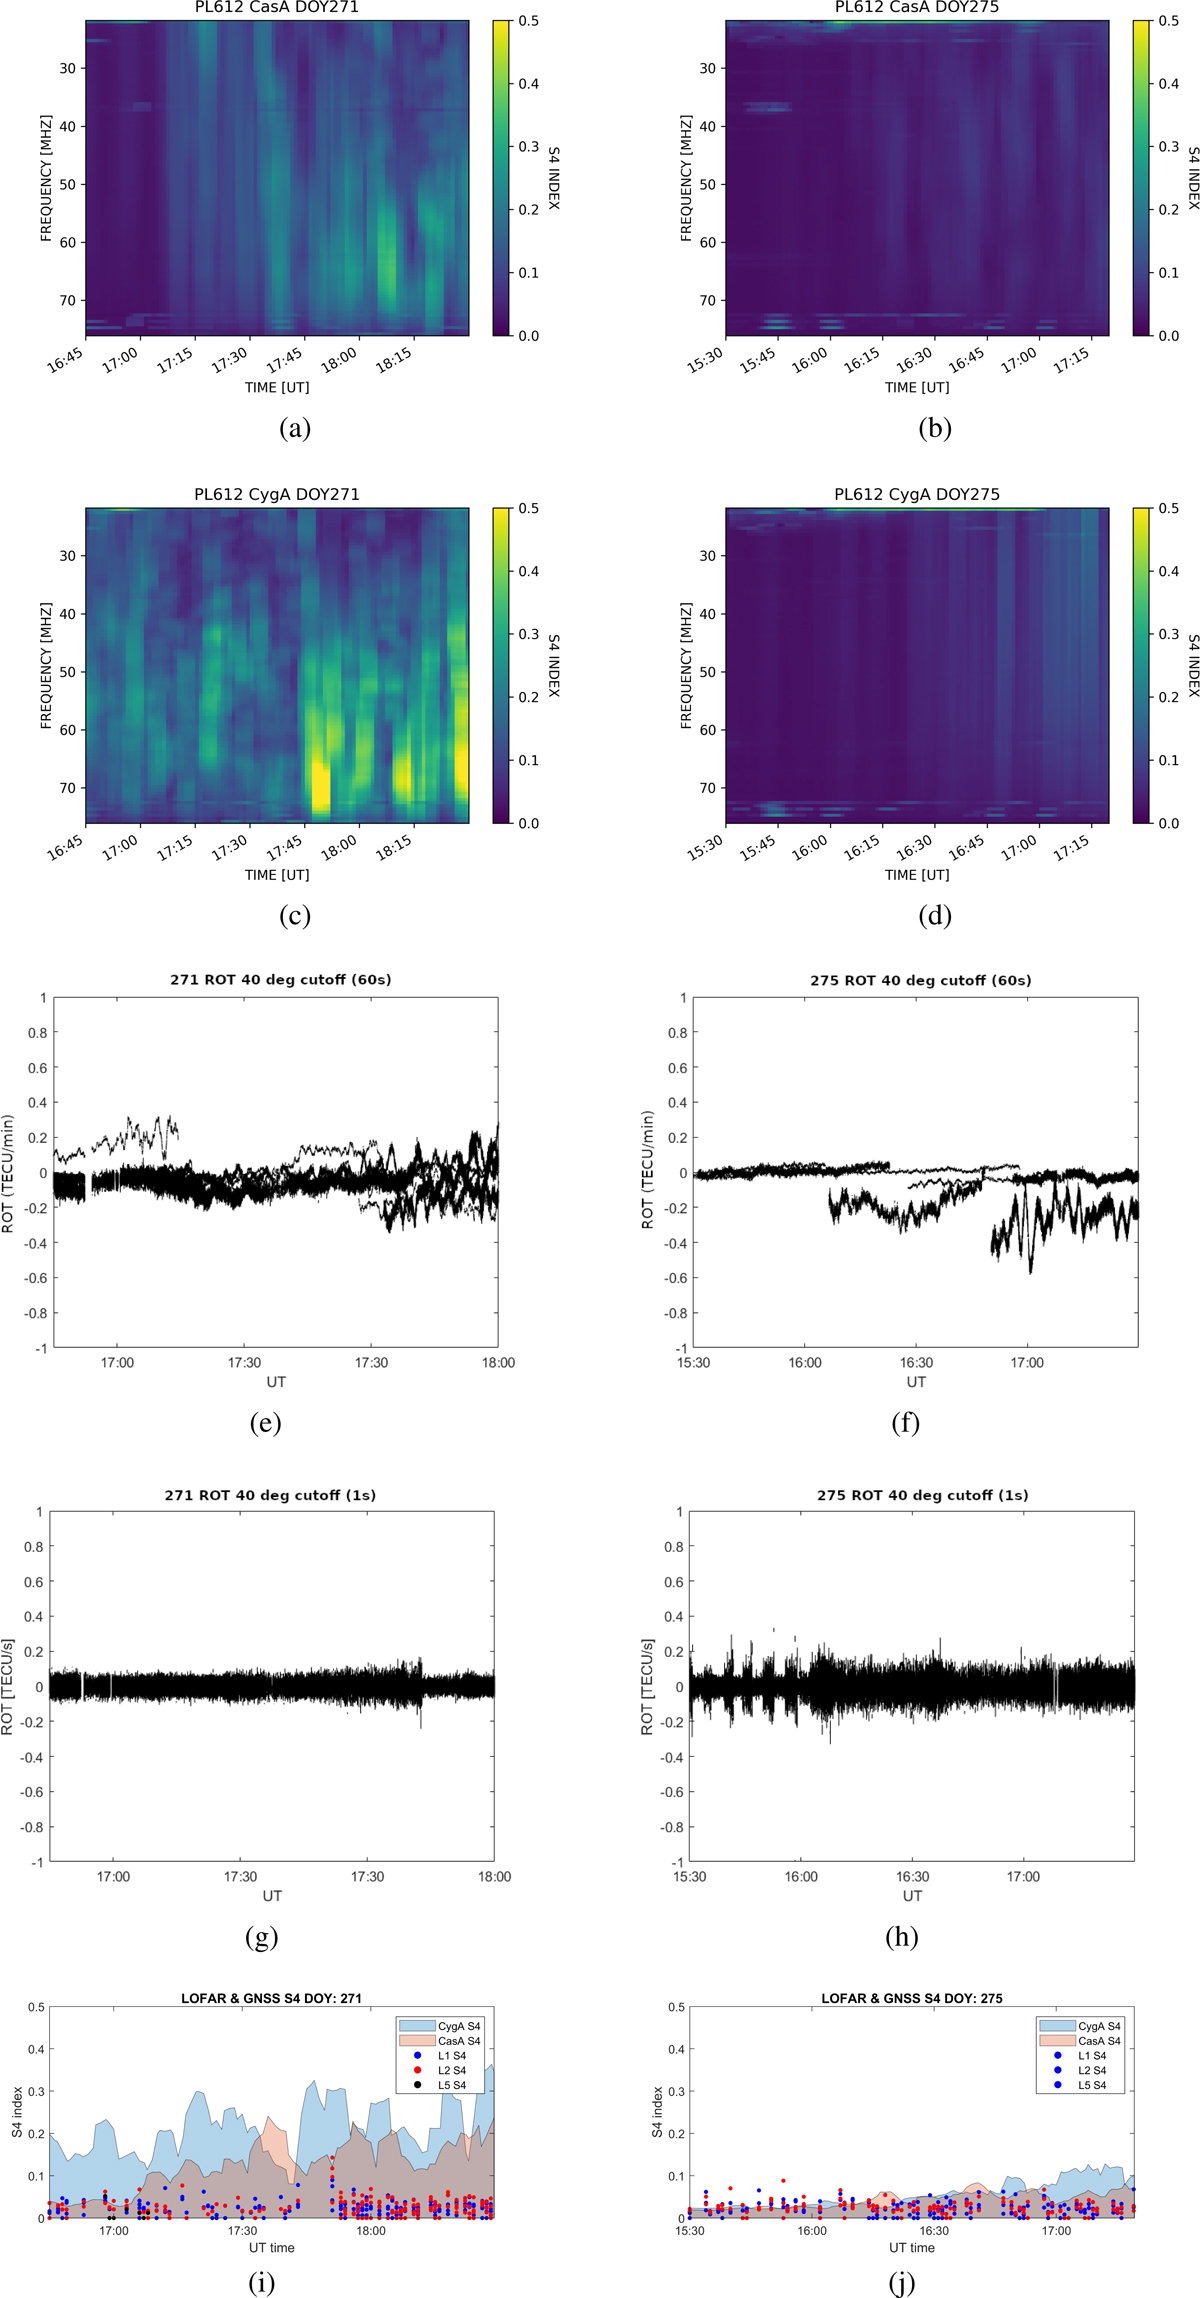
LOFAR S4 of CasA (a, b) and CygA (c, d) calculated respectively for days 271 and 275 of 2017, recorded on LOFAR station PL612. ROT values calculated for 1 s (e, f) and 60 s (g, h) for days 271 and 275 of 2017. GNSS S4 index observed on L1, L2 and L5 frequencies recorded with the ionospheric monitor collocated with the PL612 LOFAR station superimposed on CasA and CygA S4 index calculated for the 48.92 MHz channel (i, j).
Current usage metrics show cumulative count of Article Views (full-text article views including HTML views, PDF and ePub downloads, according to the available data) and Abstracts Views on Vision4Press platform.
Data correspond to usage on the plateform after 2015. The current usage metrics is available 48-96 hours after online publication and is updated daily on week days.
Initial download of the metrics may take a while.