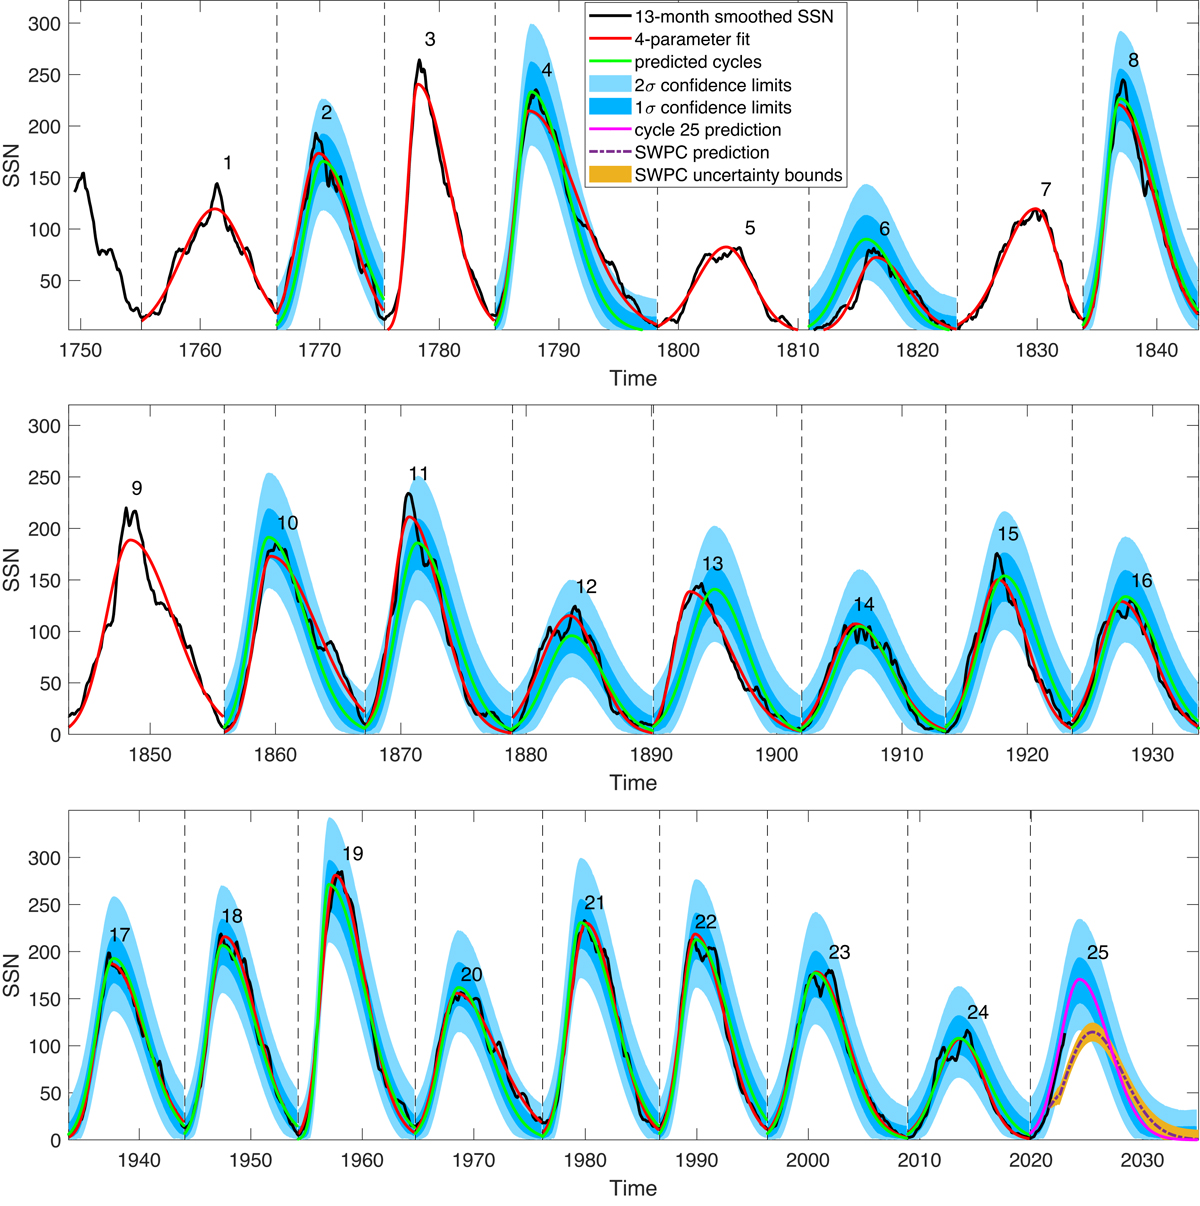
Figure 11

Download original image
Predicted past sunspot cycles as well as the prediction for cycle 25. The black curve shows the original 13-month smoothed SSN. The red curves show the optimal 4-parameter fits to the SSN cycles. The green curves show the sunspot cycles predicted using the precursor values. The dark and light blue shadings show the 1- and 2-standard deviation ranges based on the ensemble of SSN predictions. The magenta curve shows the prediction for cycle 25 and the dashed purple curve (and yellow uncertainty range) shows the cycle 25 prediction according to the international sunspot prediction panel obtained from the Space Weather Prediction Center.
Current usage metrics show cumulative count of Article Views (full-text article views including HTML views, PDF and ePub downloads, according to the available data) and Abstracts Views on Vision4Press platform.
Data correspond to usage on the plateform after 2015. The current usage metrics is available 48-96 hours after online publication and is updated daily on week days.
Initial download of the metrics may take a while.


