Figure 3
Download original image
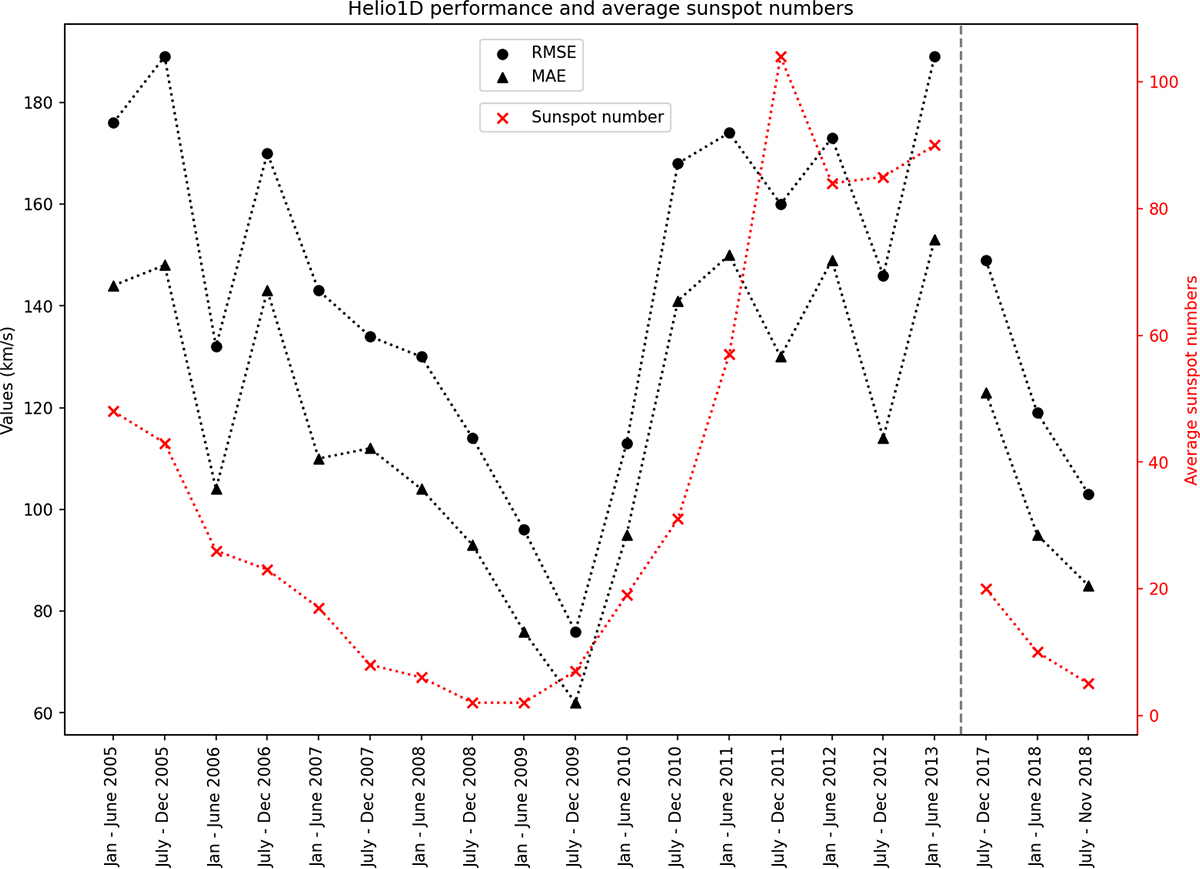
The average RMSE (dot) and MAE (triangle) for a 6-month interval. The values of the three metrics are shown on the left Y-axis (black), in comparison to the average sunspot numbers (cross) on the right Y-axis (red) for the same intervals. The data for 2005–2013 (solar cycle 23) and 2017–2018 (solar cycle 24) are separated by a vertical grey dashed line. The individual metric values for each solar cycle are connected by dotted lines.
Current usage metrics show cumulative count of Article Views (full-text article views including HTML views, PDF and ePub downloads, according to the available data) and Abstracts Views on Vision4Press platform.
Data correspond to usage on the plateform after 2015. The current usage metrics is available 48-96 hours after online publication and is updated daily on week days.
Initial download of the metrics may take a while.