Figure 7
Download original image
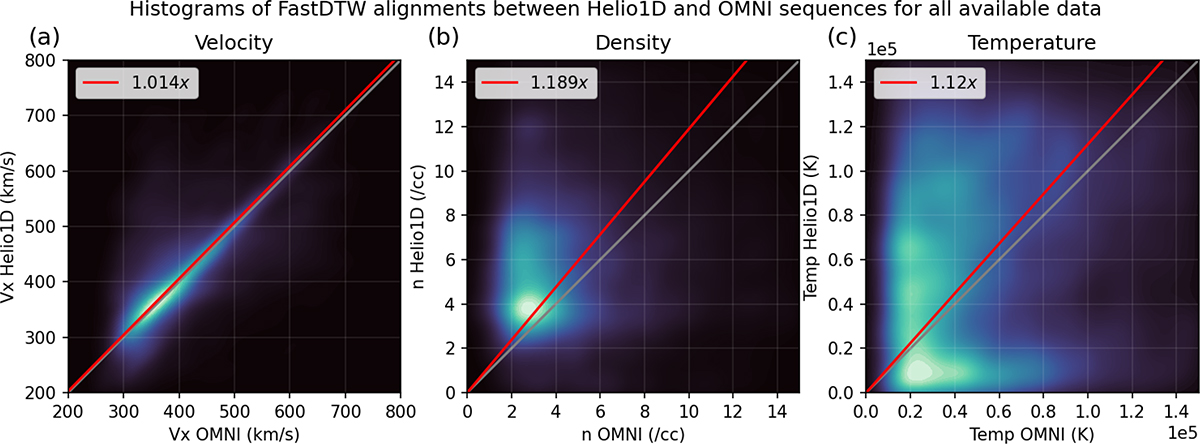
Heatmap of the FastDTW alignments between Helio1D (vertical axis) and OMNI (horizontal axis) sequences for (a) solar wind speed, (b) number density, and (c) temperature produced using all the data. Brighter regions have higher probability density than darker regions. Red solid lines show best linear fits with intercepts at zero. Grey solid lines show the lines with slope equal to one.
Current usage metrics show cumulative count of Article Views (full-text article views including HTML views, PDF and ePub downloads, according to the available data) and Abstracts Views on Vision4Press platform.
Data correspond to usage on the plateform after 2015. The current usage metrics is available 48-96 hours after online publication and is updated daily on week days.
Initial download of the metrics may take a while.