Figure 1
Download original image
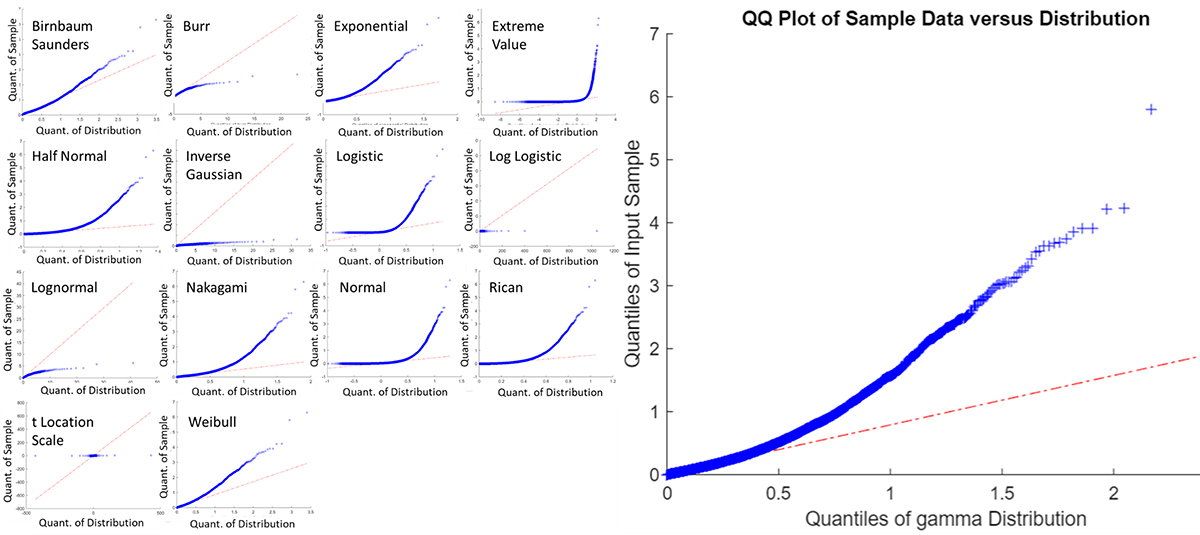
Quantile-quantile (QQ) plots for |Grad_Ne@100km| in the polar region when different distributions are trialled to represent these data. The distributions trialled were: First row, left to right: Birnbaum Saunders, Burr, Exponential and Extreme Value. Second row, left to right: Half normal, Inverse Gaussian, Logistic and Loglogistic. Third row, left to right: Lognormal, Nakagami, Normal and Rician. Fourth row, left to right: tLocation Scale and Weibull distributions. Right-hand panel: Gamma.
Current usage metrics show cumulative count of Article Views (full-text article views including HTML views, PDF and ePub downloads, according to the available data) and Abstracts Views on Vision4Press platform.
Data correspond to usage on the plateform after 2015. The current usage metrics is available 48-96 hours after online publication and is updated daily on week days.
Initial download of the metrics may take a while.