Figure 1
Download original image
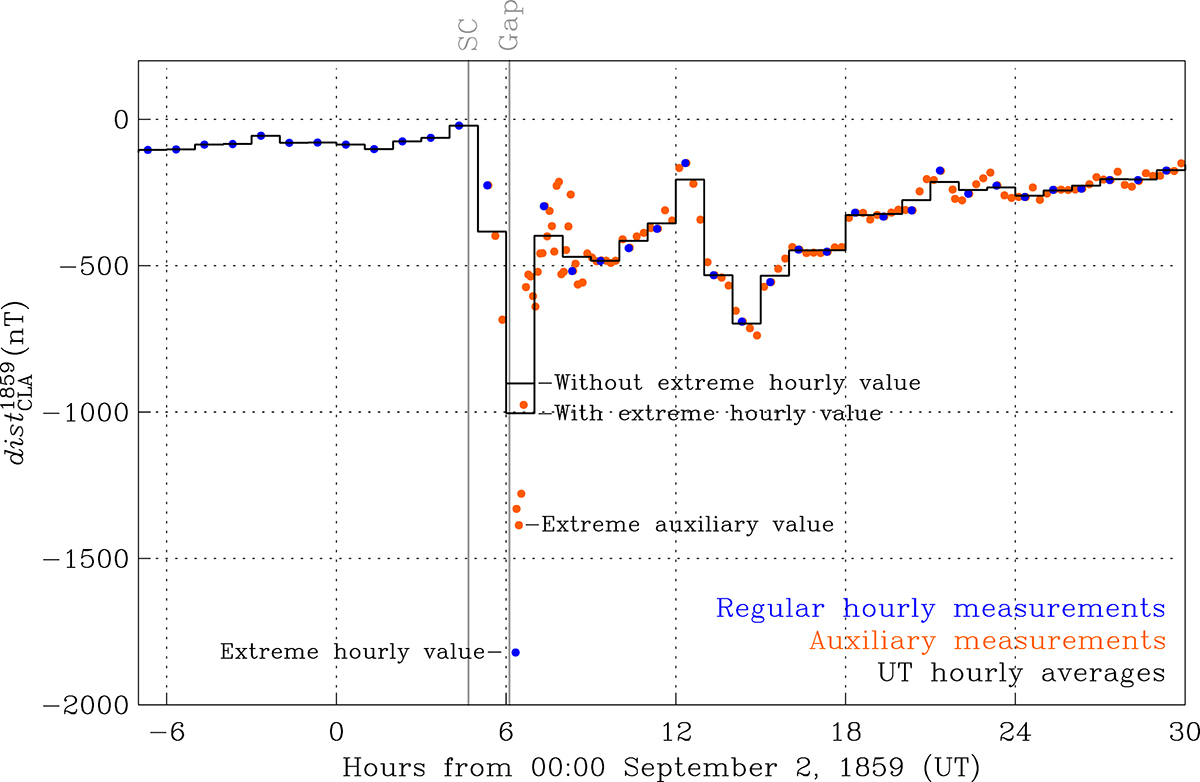
Time sequences of Colaba (CLA) disturbance values ![]() , equation (4), from 17:00 September 1 to 12:00 September 3, 1859, UT: regular hourly measurements (blue), auxiliary measurements (orange) made during periods of disturbance, UT-boxcar averages (black), the time of an apparent gap in the auxiliary measurements (grey). The hourly average centred on 06:30 UT is shown with and without the extreme hourly disturbance value at 06:20 UT. This figure can be compared with Hayakawa et al. (2022a). SC denotes sudden commencement; Gap denotes possible location of a data gap.
, equation (4), from 17:00 September 1 to 12:00 September 3, 1859, UT: regular hourly measurements (blue), auxiliary measurements (orange) made during periods of disturbance, UT-boxcar averages (black), the time of an apparent gap in the auxiliary measurements (grey). The hourly average centred on 06:30 UT is shown with and without the extreme hourly disturbance value at 06:20 UT. This figure can be compared with Hayakawa et al. (2022a). SC denotes sudden commencement; Gap denotes possible location of a data gap.
Current usage metrics show cumulative count of Article Views (full-text article views including HTML views, PDF and ePub downloads, according to the available data) and Abstracts Views on Vision4Press platform.
Data correspond to usage on the plateform after 2015. The current usage metrics is available 48-96 hours after online publication and is updated daily on week days.
Initial download of the metrics may take a while.