Figure 3
Download original image
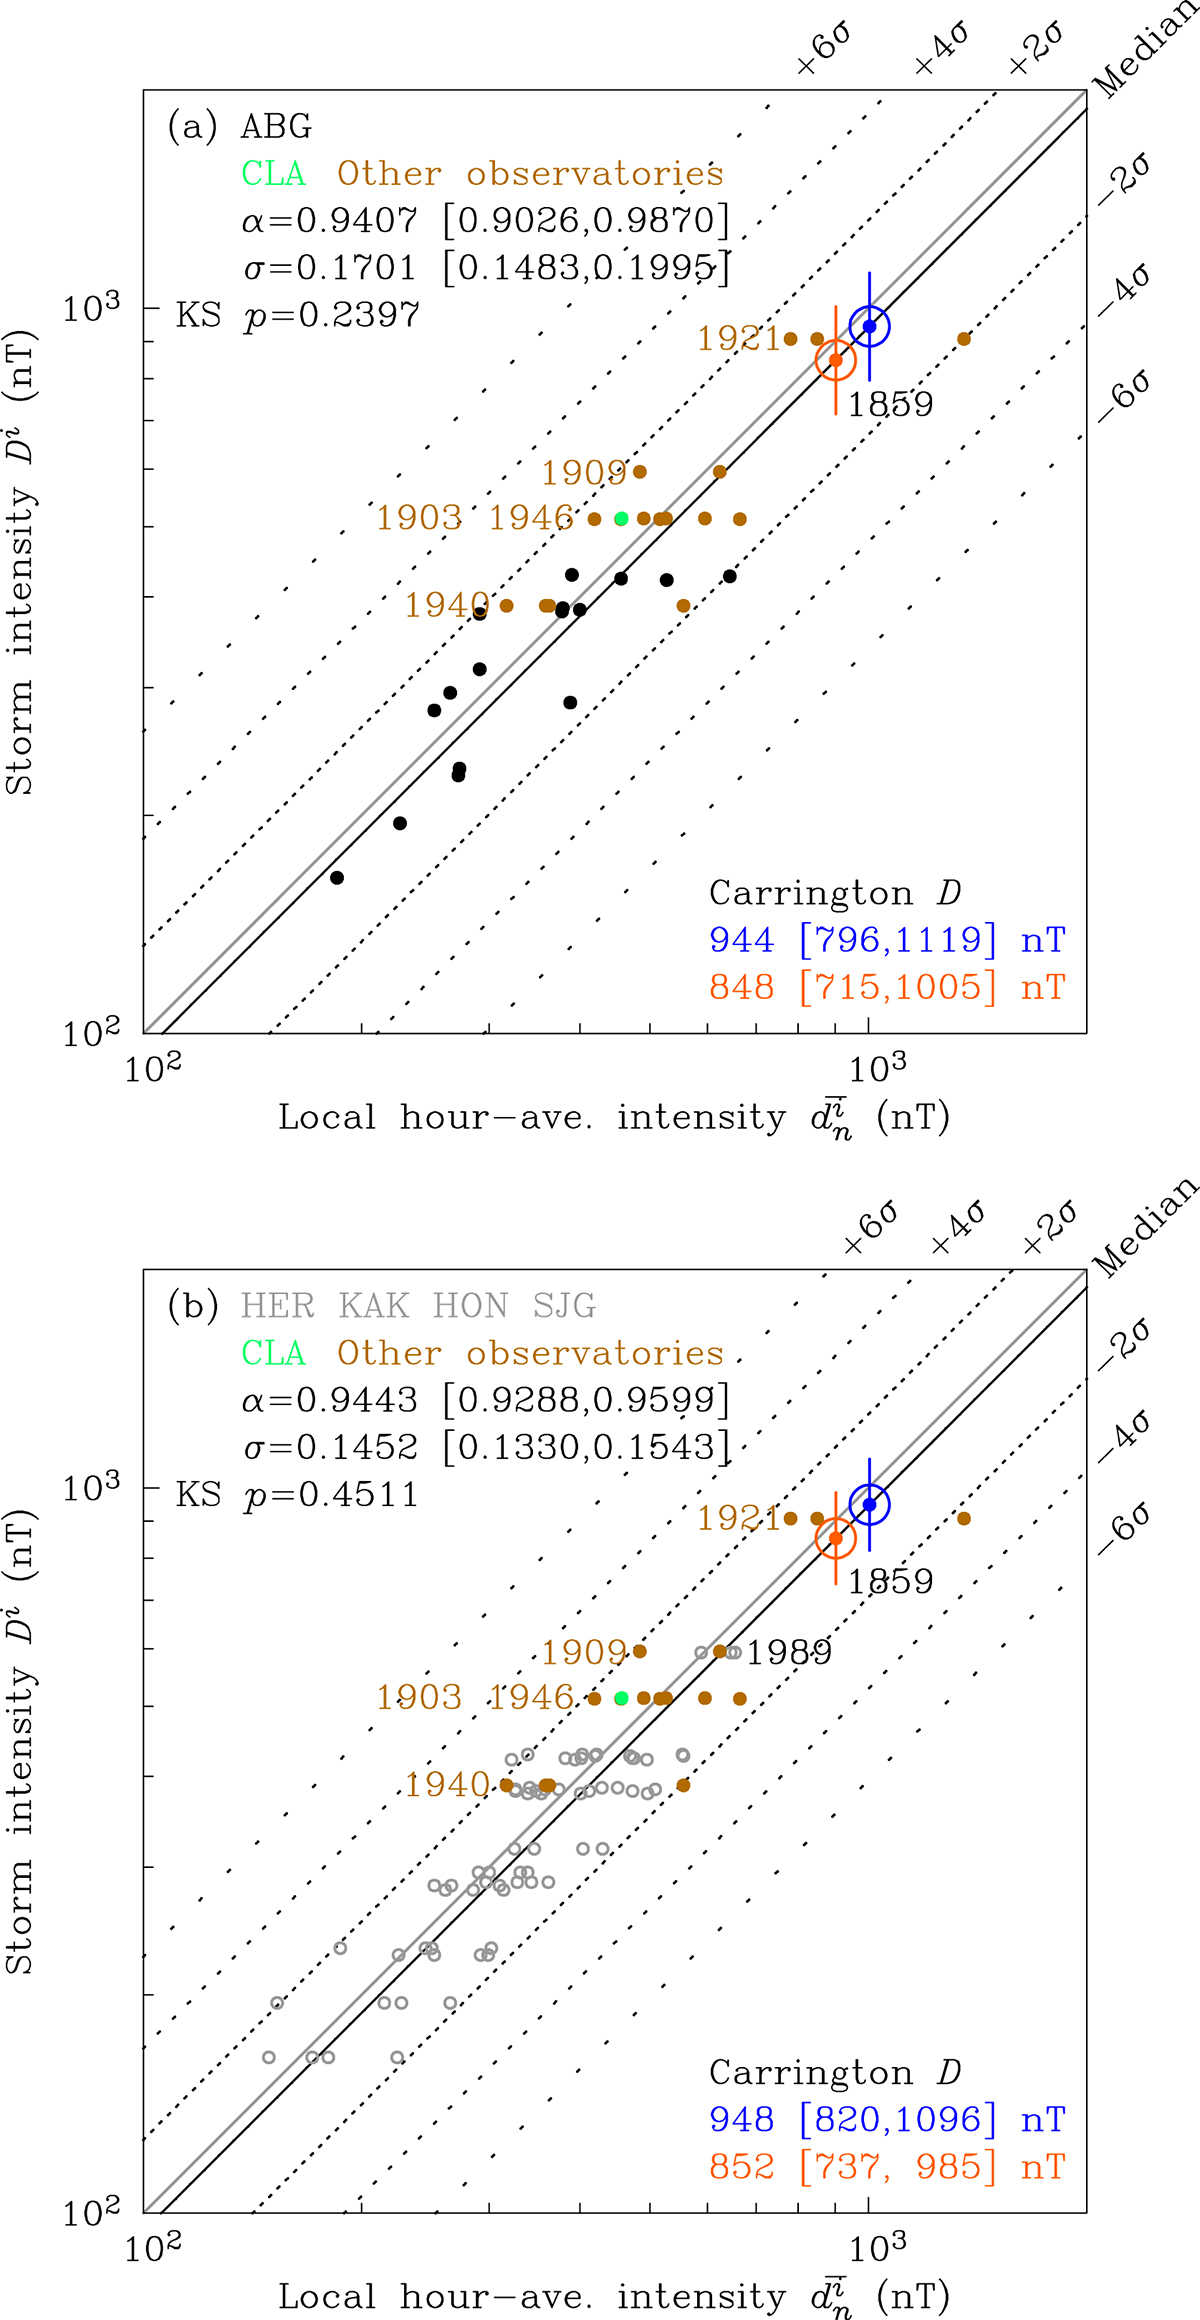
Contour lines of the (log)normal density function g(ln Di|ln ![]() , ln α, σ), equation (8): median (black solid line) and (black dotted lines) ±2σ, etc. intervals (dotted lines); intensities Di and
, ln α, σ), equation (8): median (black solid line) and (black dotted lines) ±2σ, etc. intervals (dotted lines); intensities Di and ![]() from Table 2 (1957–2015): (a) Alibag (black, ABG) and (b) the four standard Dst observatories (grey, open circles), Hermanus (HER), Kakioka (KAK), Honolulu (HON), San Juan (SJG). Also shown: data from Table 4 (brown, green) for five other superstorms (1903, 1909, 1921, 1940, 1946). In each of (a, b) estimates of Carrington-storm D1859 are shown for Colaba
from Table 2 (1957–2015): (a) Alibag (black, ABG) and (b) the four standard Dst observatories (grey, open circles), Hermanus (HER), Kakioka (KAK), Honolulu (HON), San Juan (SJG). Also shown: data from Table 4 (brown, green) for five other superstorms (1903, 1909, 1921, 1940, 1946). In each of (a, b) estimates of Carrington-storm D1859 are shown for Colaba ![]() with (blue) and without (orange) the extreme disturbance value at 06:20 UT. 68% (±1σ) credibility intervals in brackets. Bootstrap Kolmogorov-Smirnov probability, KS p.
with (blue) and without (orange) the extreme disturbance value at 06:20 UT. 68% (±1σ) credibility intervals in brackets. Bootstrap Kolmogorov-Smirnov probability, KS p.
Current usage metrics show cumulative count of Article Views (full-text article views including HTML views, PDF and ePub downloads, according to the available data) and Abstracts Views on Vision4Press platform.
Data correspond to usage on the plateform after 2015. The current usage metrics is available 48-96 hours after online publication and is updated daily on week days.
Initial download of the metrics may take a while.