Figure 5
Download original image
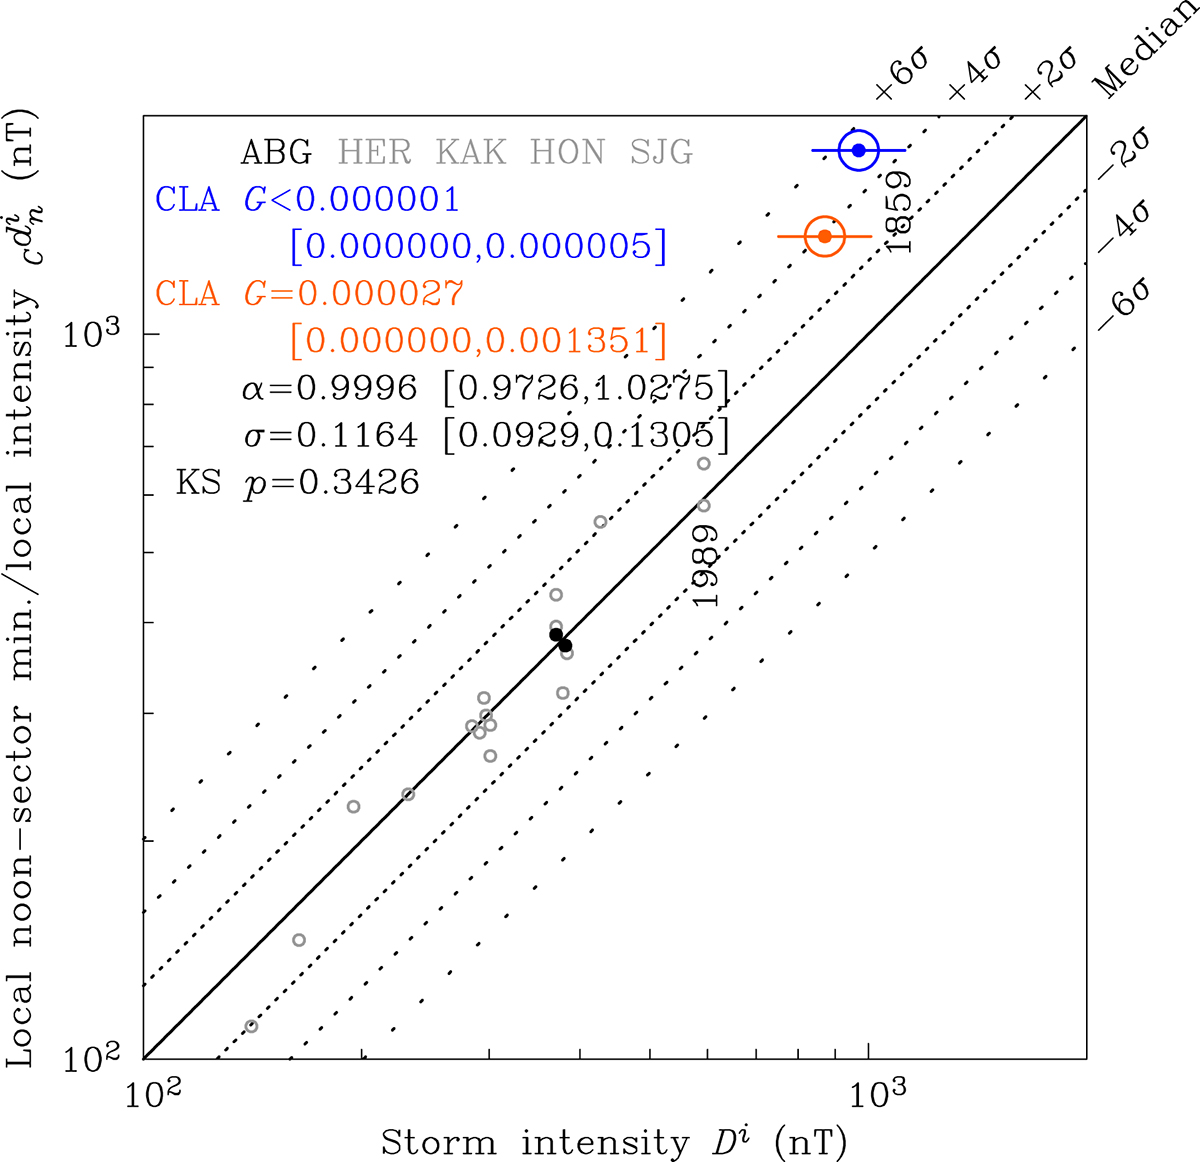
Contour lines of the (log)normal density function g(ln ![]() |ln Di, ln α, σ), equation (13): median (black solid line) and ±2σ intervals (dotted lines); intensities Di and
|ln Di, ln α, σ), equation (13): median (black solid line) and ±2σ intervals (dotted lines); intensities Di and ![]() from Table 5 (1989–2015): Alibag (black, ABG) and the four standard Dst observatories (grey, open circles), Hermanus (HER), Kakioka (KAK), Honolulu (HON), San Juan (SJG). The model enables estimation of an exceedance probability G(ln
from Table 5 (1989–2015): Alibag (black, ABG) and the four standard Dst observatories (grey, open circles), Hermanus (HER), Kakioka (KAK), Honolulu (HON), San Juan (SJG). The model enables estimation of an exceedance probability G(ln ![]() |ln Di, ln α, σ), equation (14), for a local-noon sector (09:00 to 14:59) intensity ln
|ln Di, ln α, σ), equation (14), for a local-noon sector (09:00 to 14:59) intensity ln ![]() , equation (12) from a single low-latitude observatory, where data have been sparsely sampled as done at Colaba during the Carrington storm, given an hourly average storm intensity Di, equation (5). G estimated with (blue) and without (orange) the extreme disturbance value at 06:20 UT.
, equation (12) from a single low-latitude observatory, where data have been sparsely sampled as done at Colaba during the Carrington storm, given an hourly average storm intensity Di, equation (5). G estimated with (blue) and without (orange) the extreme disturbance value at 06:20 UT.
Current usage metrics show cumulative count of Article Views (full-text article views including HTML views, PDF and ePub downloads, according to the available data) and Abstracts Views on Vision4Press platform.
Data correspond to usage on the plateform after 2015. The current usage metrics is available 48-96 hours after online publication and is updated daily on week days.
Initial download of the metrics may take a while.