Figure 1
Download original image
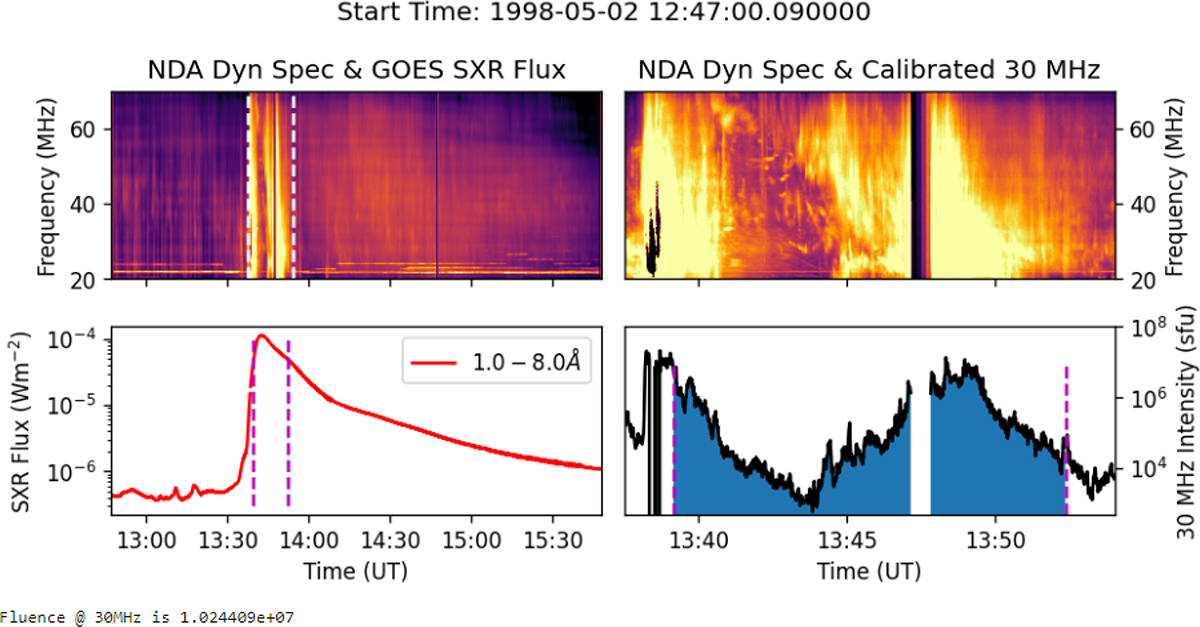
Example event, showing the calibrated dynamic spectrum of the NDA (top left panel) used for one of the 200 selected flares. The radio emission is shown also in detail during the period used for the radio fluence computation (top right panel) as well as the 30 MHz intensity (bottom right panel). The related GOES SXR burst is also shown (bottom-left). The time intervals for the fluence calculation for both SXR and radio data at 30 MHz are marked with a dashed violet line (bottom panels), while the integrated value used to calculate the fluence is marked with a blue area (bottom-right).
Current usage metrics show cumulative count of Article Views (full-text article views including HTML views, PDF and ePub downloads, according to the available data) and Abstracts Views on Vision4Press platform.
Data correspond to usage on the plateform after 2015. The current usage metrics is available 48-96 hours after online publication and is updated daily on week days.
Initial download of the metrics may take a while.