Figure 2
Download original image
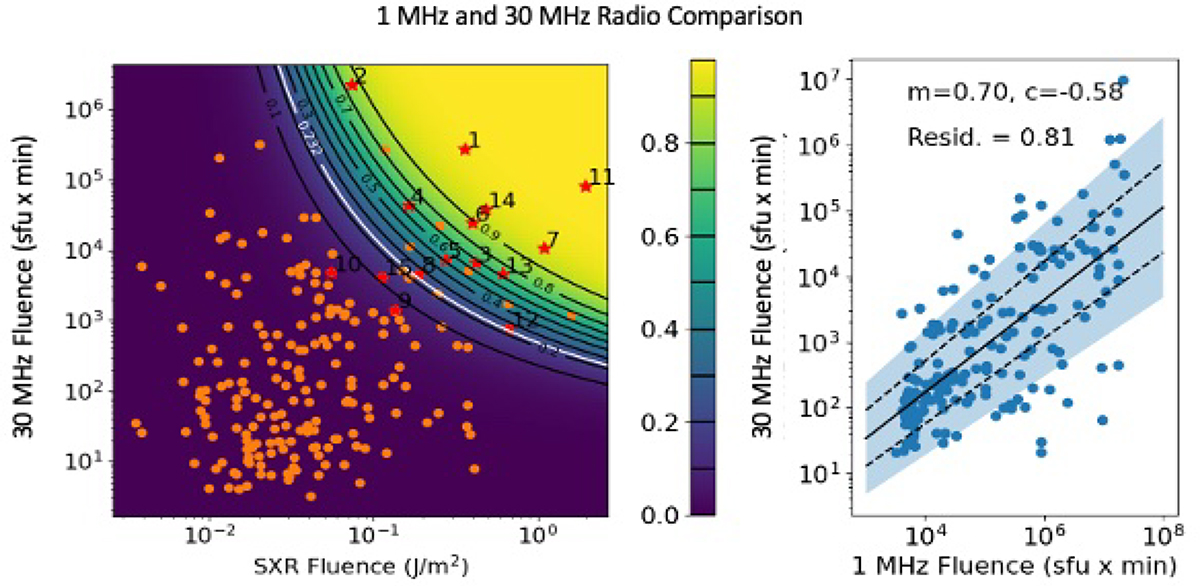
Scatter plot (left) of the 30 MHz fluence vs the SXR one, including also the probability curves (black lines) for ESPERTA recalculated using ground-based radio data at 30 MHz for the 200 flares selected for this study. The probability contour threshold (see the text) is indicated by the white line. Red circles indicate SPE-associated flares, whereas orange circles indicate flares not associated with any SPE. A scatter plot showing the correlation of the radio fluence at 1 MHz and 30 MHz for 200 events of the ESPERTA list extended to 2017 (right). The black dashed lines represent the fit 1σ uncertainty, while the 2σ confidence level is marked with a blue area.
Current usage metrics show cumulative count of Article Views (full-text article views including HTML views, PDF and ePub downloads, according to the available data) and Abstracts Views on Vision4Press platform.
Data correspond to usage on the plateform after 2015. The current usage metrics is available 48-96 hours after online publication and is updated daily on week days.
Initial download of the metrics may take a while.