Figure 4
Download original image
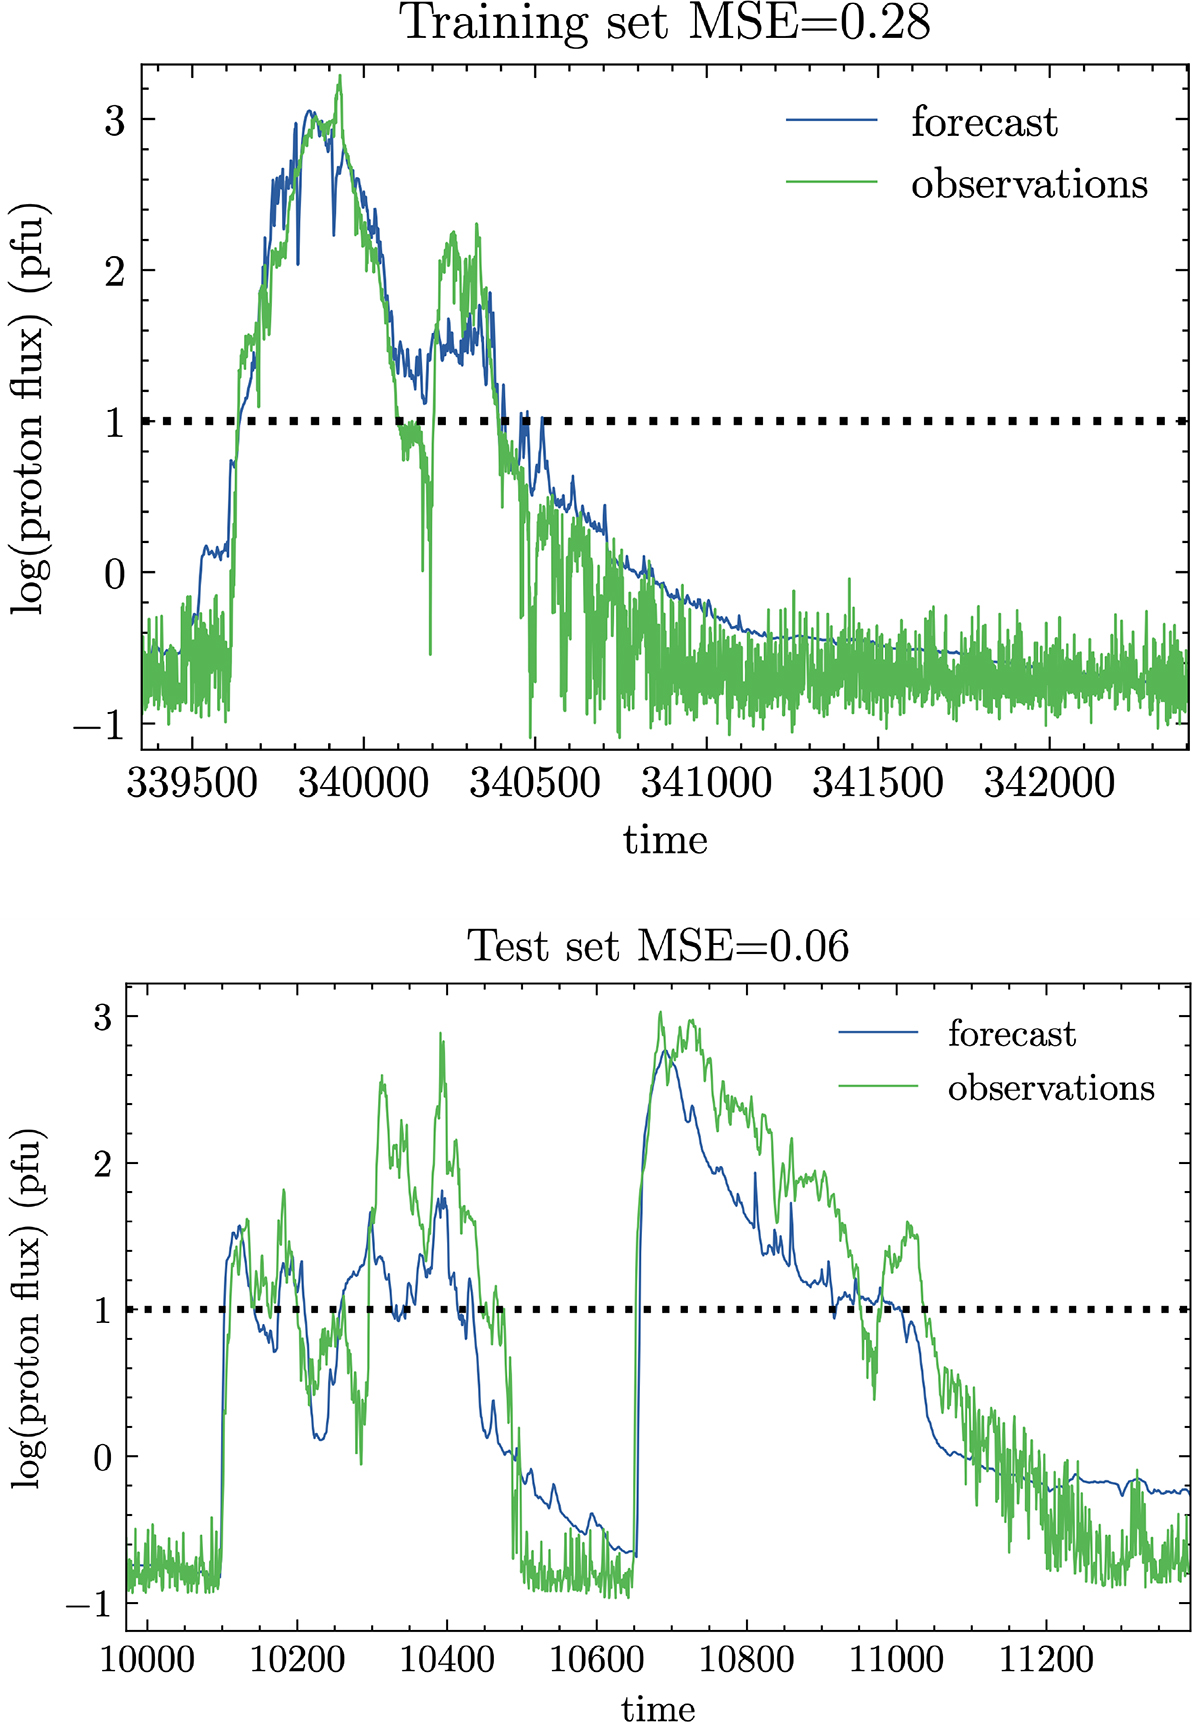
Predictions (blue line) of the proton flux by employing the LSTM compared with observations (green line) for one event in the training set (top) and one in the test set (bottom). The predicted profiles are shifted 1 h ahead. The RMSE is given by the square root of the MSE.
Current usage metrics show cumulative count of Article Views (full-text article views including HTML views, PDF and ePub downloads, according to the available data) and Abstracts Views on Vision4Press platform.
Data correspond to usage on the plateform after 2015. The current usage metrics is available 48-96 hours after online publication and is updated daily on week days.
Initial download of the metrics may take a while.