Figure 1
Download original image
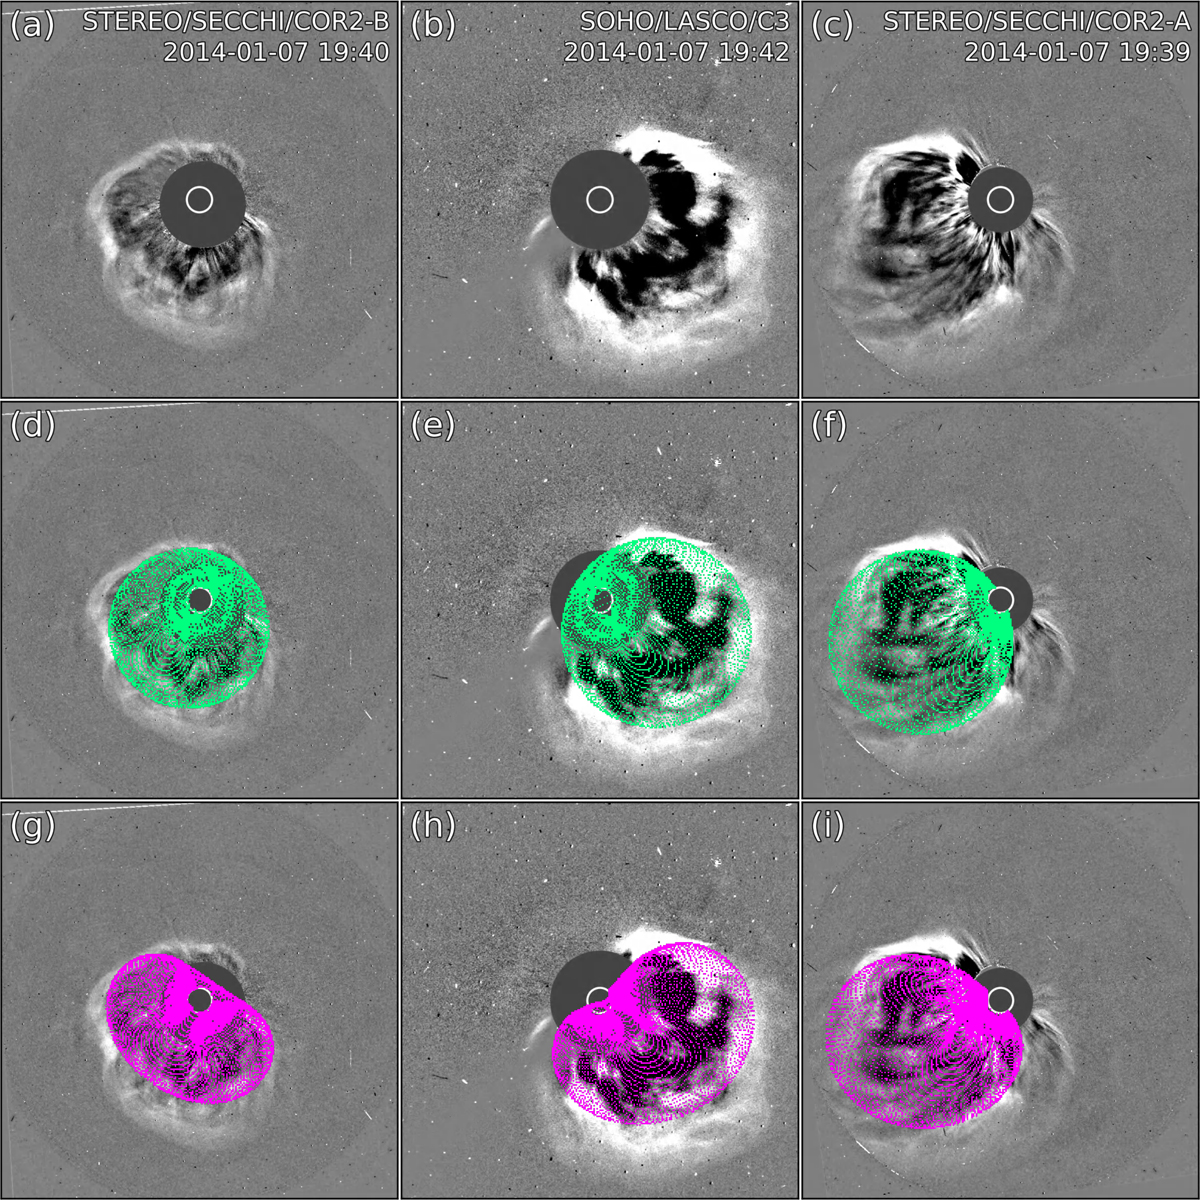
Example of a CME (from 7 January 2014) fitted in the solar corona using the cone and croissant models. The top row (a–c) shows white-light data from three viewpoints (Earth/SOHO, STEREO-A, and STEREO-B), the middle row (d–f) shows the same set of data with the cone wireframe (in green) overlaid, and the bottom row (g–i) shows the same set of data with the croissant wireframe (in magenta) overlaid. Both sets of reconstructions were performed using the GCS model, with the difference that for the cone case the so-called half-width parameter (quantifying the half-angular separation between the CME legs) was set to zero.
Current usage metrics show cumulative count of Article Views (full-text article views including HTML views, PDF and ePub downloads, according to the available data) and Abstracts Views on Vision4Press platform.
Data correspond to usage on the plateform after 2015. The current usage metrics is available 48-96 hours after online publication and is updated daily on week days.
Initial download of the metrics may take a while.