Figure 11
Download original image
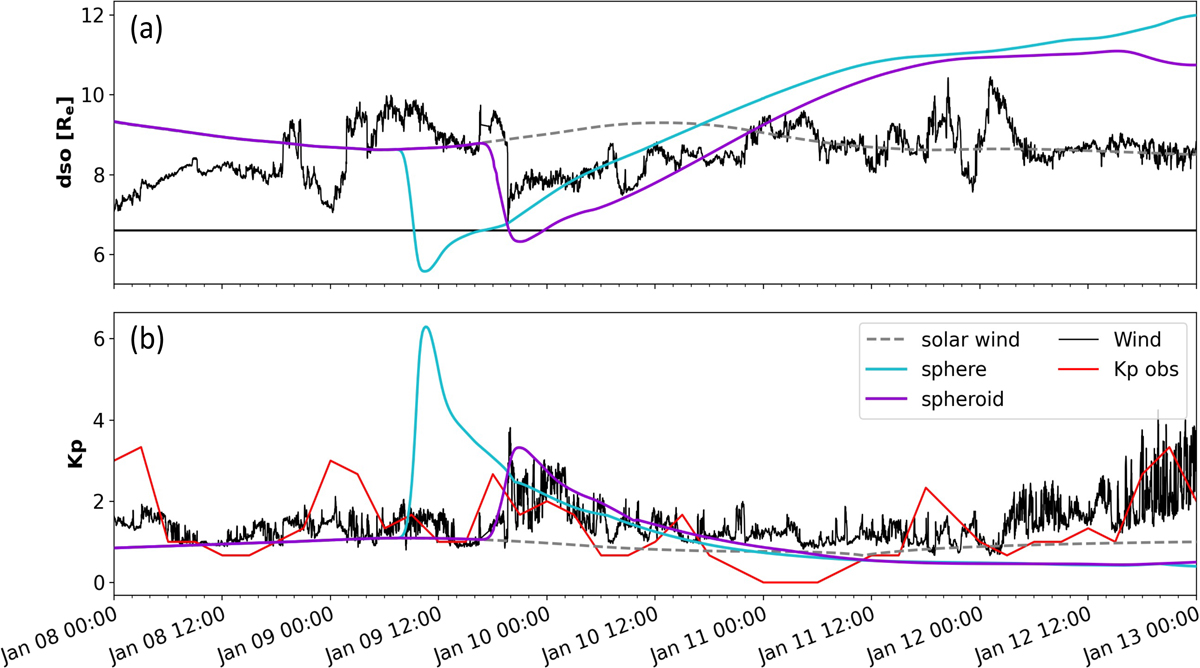
Modeled and observed CME geoeffectiveness as a function of time. (a) Magnetopause stand-off distance calculated from EUHFORIA and Wind time series using the model by Shue et al. (1997). The black horizontal line marks the geosynchronous orbits at 6.6 Re. Cone and spheroidal model results are shown in teal and violet, respectively. As a reference, ambient solar wind model results are plotted in gray. Estimates from Wind measurements are shown in black. (b) Kp index calculated from EUHFORIA and Wind time series using the relation by Newell et al. (2008). Three-hour Kp measurements are shown in red.
Current usage metrics show cumulative count of Article Views (full-text article views including HTML views, PDF and ePub downloads, according to the available data) and Abstracts Views on Vision4Press platform.
Data correspond to usage on the plateform after 2015. The current usage metrics is available 48-96 hours after online publication and is updated daily on week days.
Initial download of the metrics may take a while.