Figure 3

Download original image
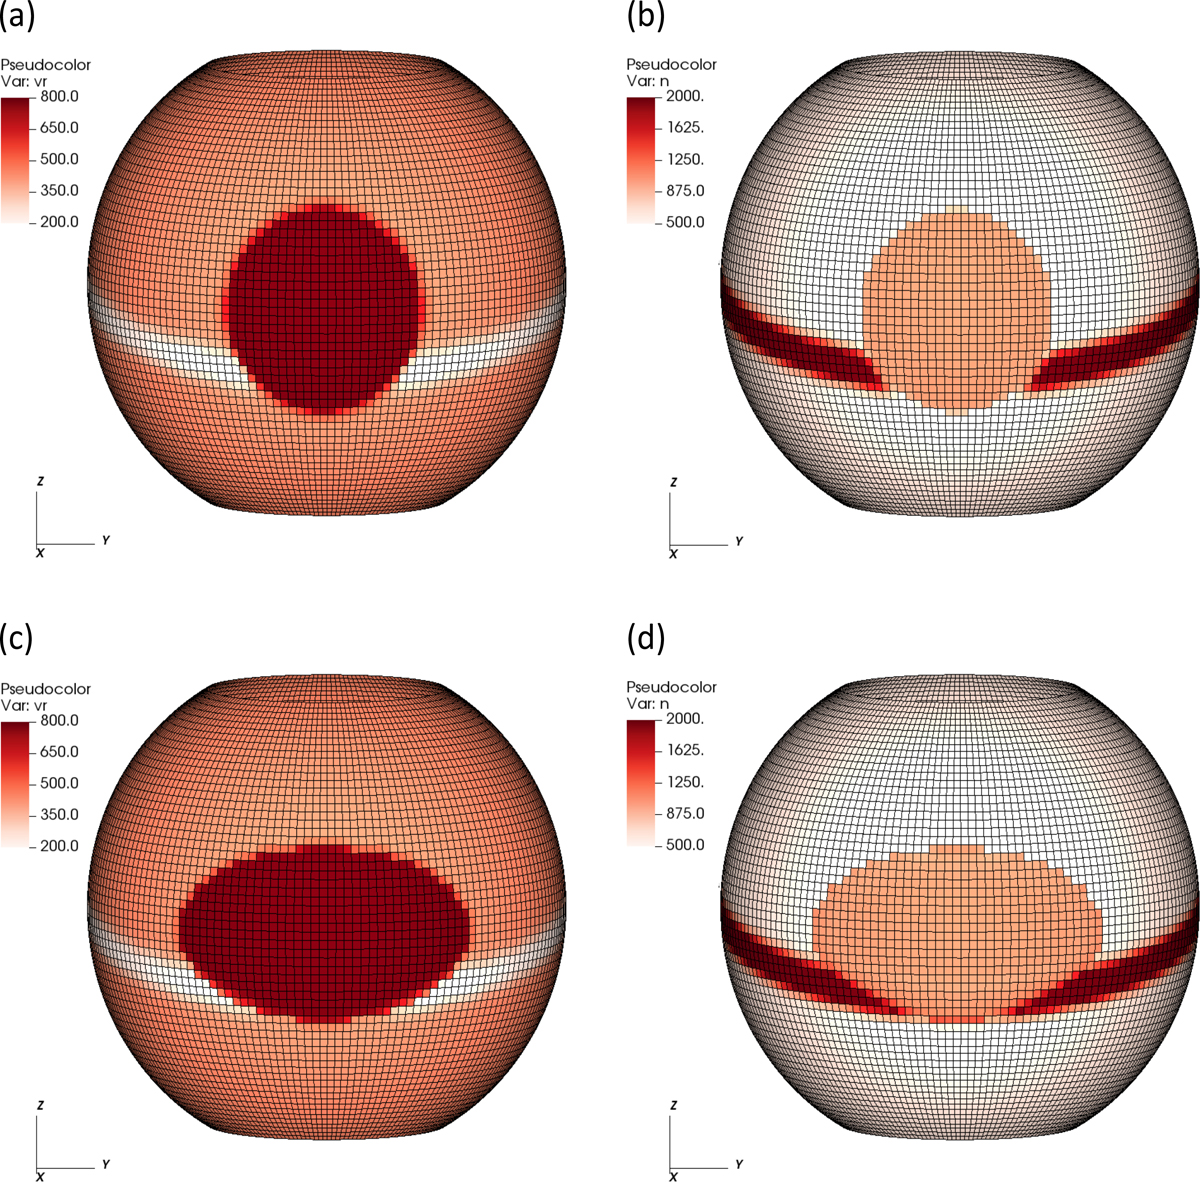
3-D views of the radial velocity (vr, in units of km s−1) and number density (n, in units of cm−3) at the heliospheric inner boundary during the CME insertion, for the two simulations performed. (a) vr for the cone (spherical) CME model, (b) n for the cone (spherical) CME model, (c) vr for the spheroidal CME model, (d) n for the spheroidal CME model. The area where the CME is being inserted (vr = 800 km s−3, n = 600 cm−3) is visible as the red (orange) patch on the left (right).
Current usage metrics show cumulative count of Article Views (full-text article views including HTML views, PDF and ePub downloads, according to the available data) and Abstracts Views on Vision4Press platform.
Data correspond to usage on the plateform after 2015. The current usage metrics is available 48-96 hours after online publication and is updated daily on week days.
Initial download of the metrics may take a while.


