Figure 4

Download original image
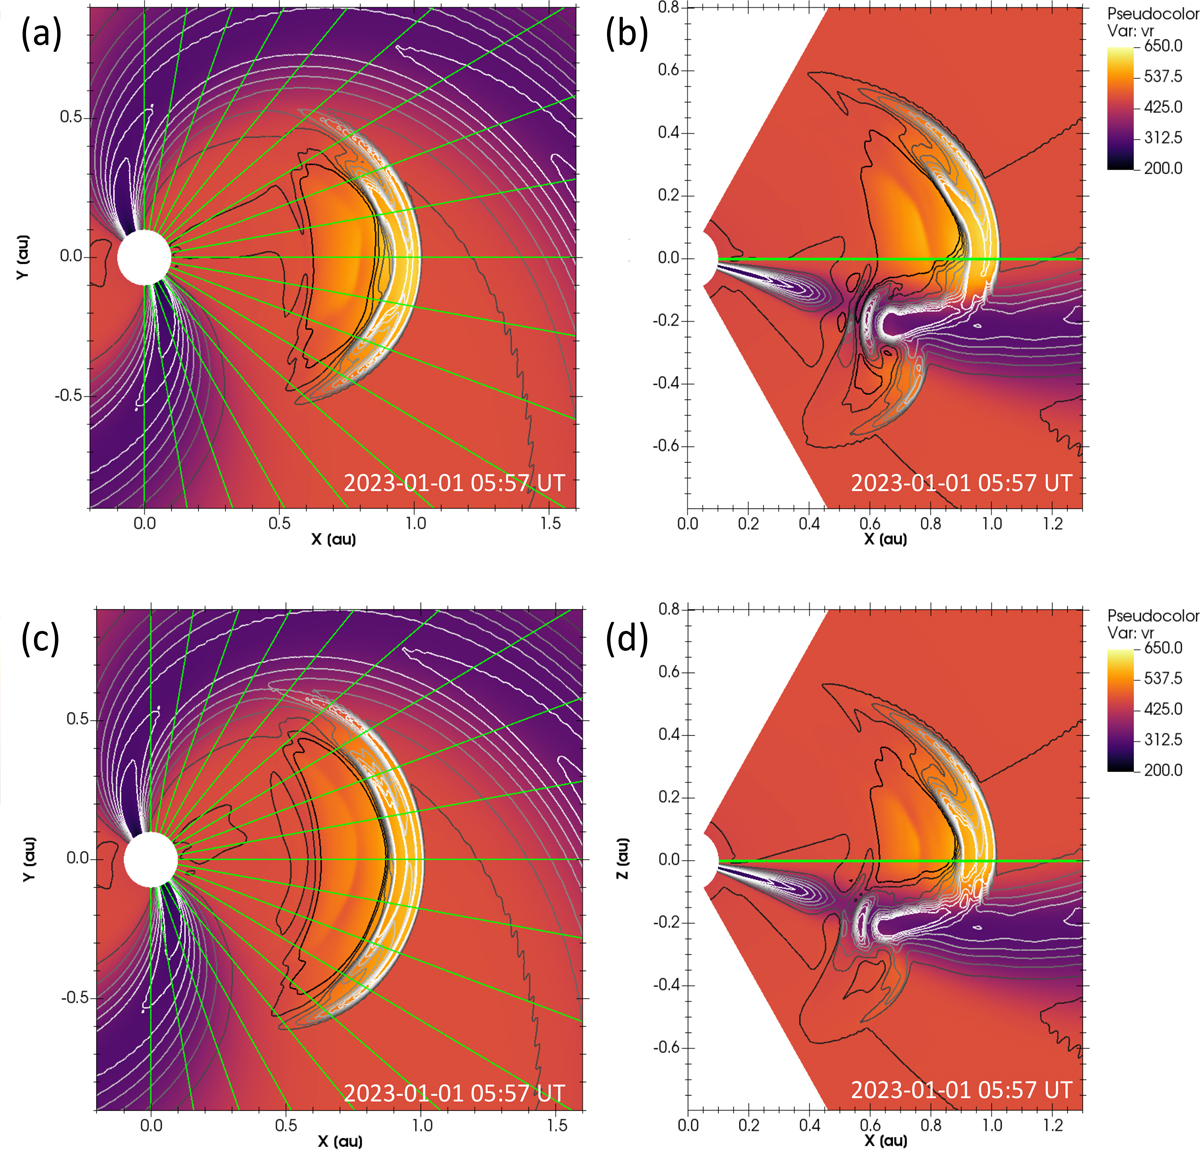
Modeling results for the fictitious CME with the sphere and spheroidal CME models. The panels show the radial speed vr in the equatorial (left) and meridional (right) plane on 2023-01-01 05:57 UT when the CME nose was close to 1 au in both simulations. Representative scaled number density nr2 values are indicated by the gray contour lines. (a, b) spherical (cone) CME model, (c, d) spheroidal CME model. The green lines marks directions to representative virtual spacecraft located at θ = 0° and ϕ between −90° and 90°, with 10° increments.
Current usage metrics show cumulative count of Article Views (full-text article views including HTML views, PDF and ePub downloads, according to the available data) and Abstracts Views on Vision4Press platform.
Data correspond to usage on the plateform after 2015. The current usage metrics is available 48-96 hours after online publication and is updated daily on week days.
Initial download of the metrics may take a while.


