Figure 8
Download original image
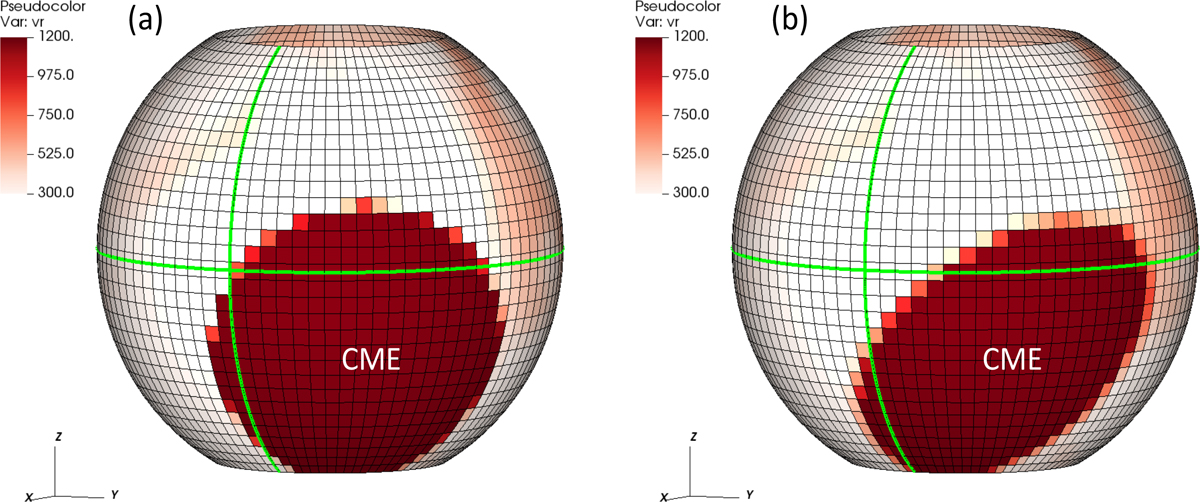
3-D views of the radial velocity (vr, in units of km s−1) at r = 0.1 au on 7 January 2014 around 22:00 UT (during the CME insertion), for the two simulations performed. (a) Cone, (b) Spheroid. The green lines mark the central meridian and the solar equator. The area where the CME is being inserted is visible as a red patch is the southwestern quadrant.
Current usage metrics show cumulative count of Article Views (full-text article views including HTML views, PDF and ePub downloads, according to the available data) and Abstracts Views on Vision4Press platform.
Data correspond to usage on the plateform after 2015. The current usage metrics is available 48-96 hours after online publication and is updated daily on week days.
Initial download of the metrics may take a while.