Figure 4
Download original image
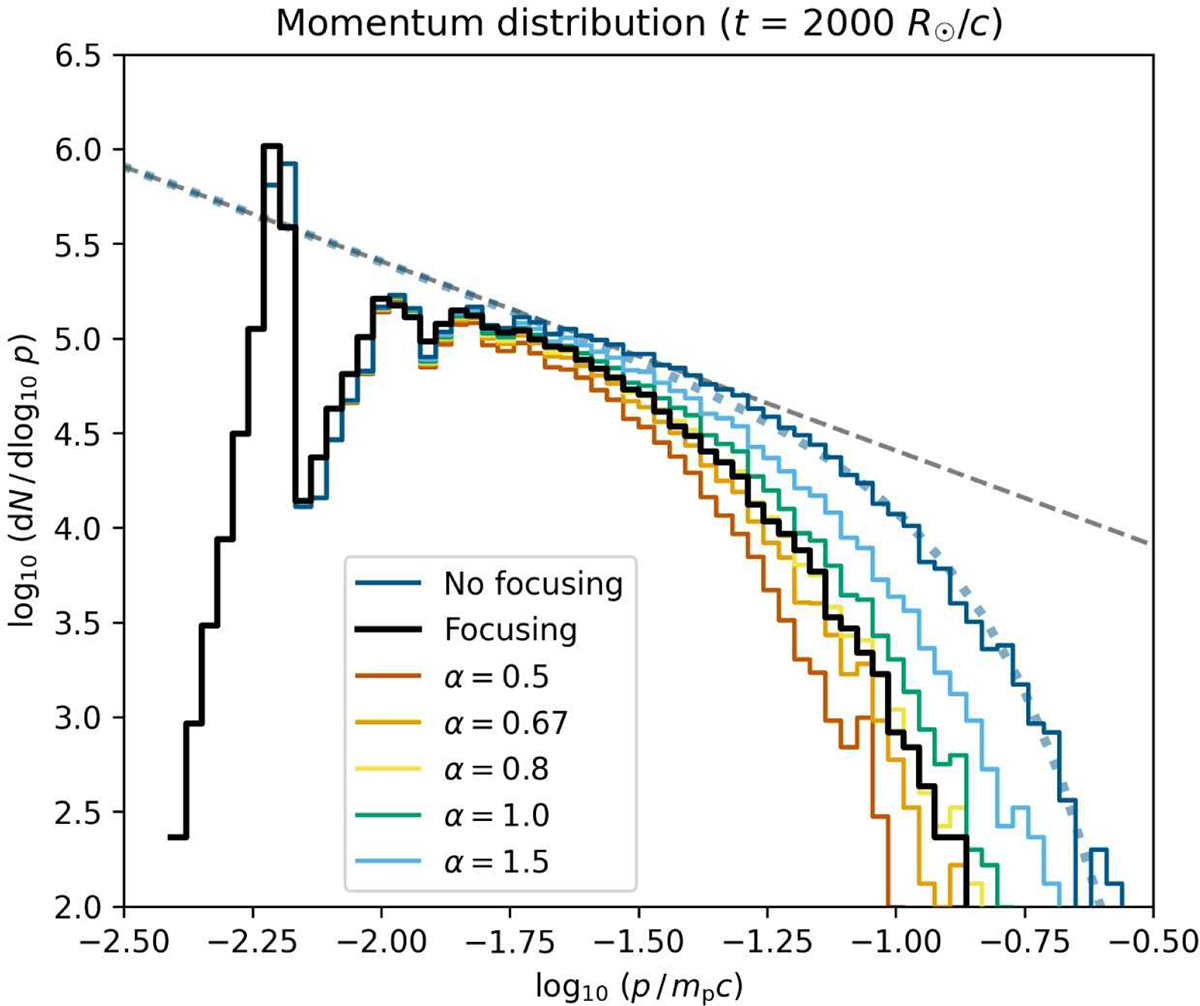
The momentum distributions of the particles in downstream close to the shock (−0.05 R⊙ < Z < 0) for no focusing, focusing, and different free-escape boundary simulation cases at a given simulation time, where the focusing and free-escape boundary cases have reached a steady state. The grey dashed line is the canonical power-law of the steady-state DSA theory and the dotted curve on the no-focusing distribution represents the product of the power-law spectrum with the exponential cut-off in energy, exp(−E/Ec).
Current usage metrics show cumulative count of Article Views (full-text article views including HTML views, PDF and ePub downloads, according to the available data) and Abstracts Views on Vision4Press platform.
Data correspond to usage on the plateform after 2015. The current usage metrics is available 48-96 hours after online publication and is updated daily on week days.
Initial download of the metrics may take a while.