Figure 6
Download original image
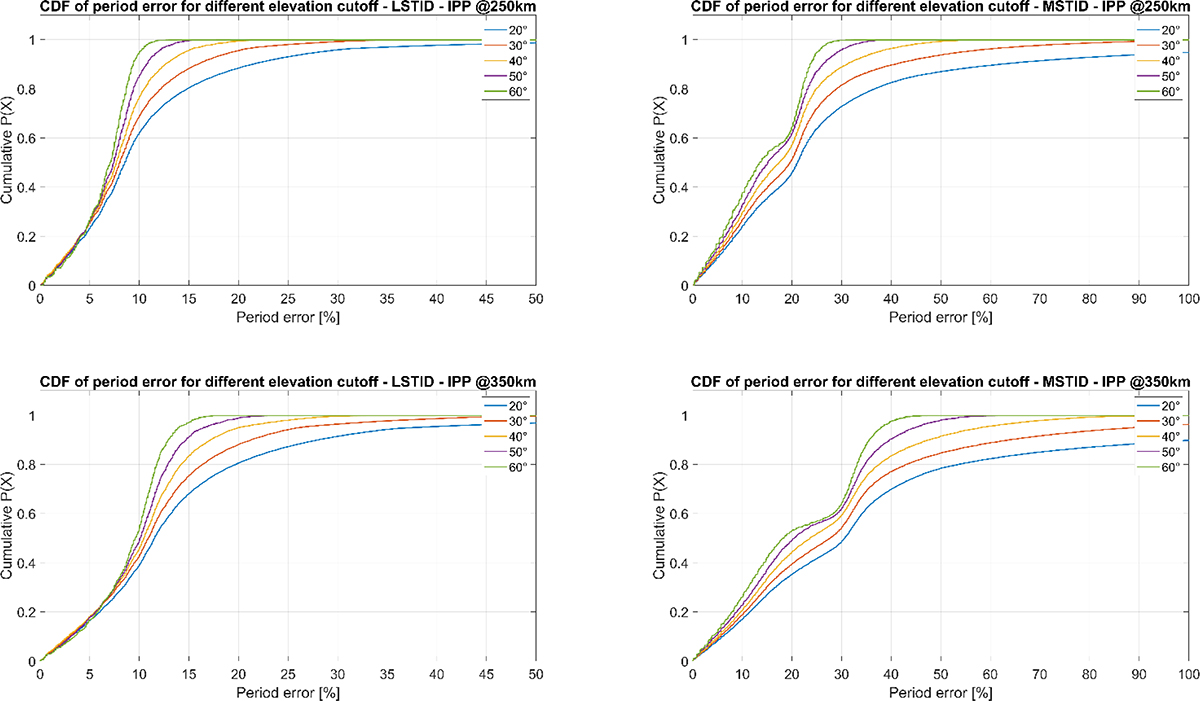
Cumulative distribution functions (CDF) of the Doppler error for different TID scenarios, heights of the IPP, and elevation masks. Plots on the right/left correspond to MSTID/LSTID, while top/bottom plots are for an IPP height of 250/350 km. The differently coloured lines show the CDF for different elevation masks, where blue, red, yellow, purple, and green are 20, 30, 40, 50, and 60 degrees, respectively. The X-axis represents the percentage period error, while the Y-axis shows the cumulative probability.
Current usage metrics show cumulative count of Article Views (full-text article views including HTML views, PDF and ePub downloads, according to the available data) and Abstracts Views on Vision4Press platform.
Data correspond to usage on the plateform after 2015. The current usage metrics is available 48-96 hours after online publication and is updated daily on week days.
Initial download of the metrics may take a while.