Figure 7
Download original image
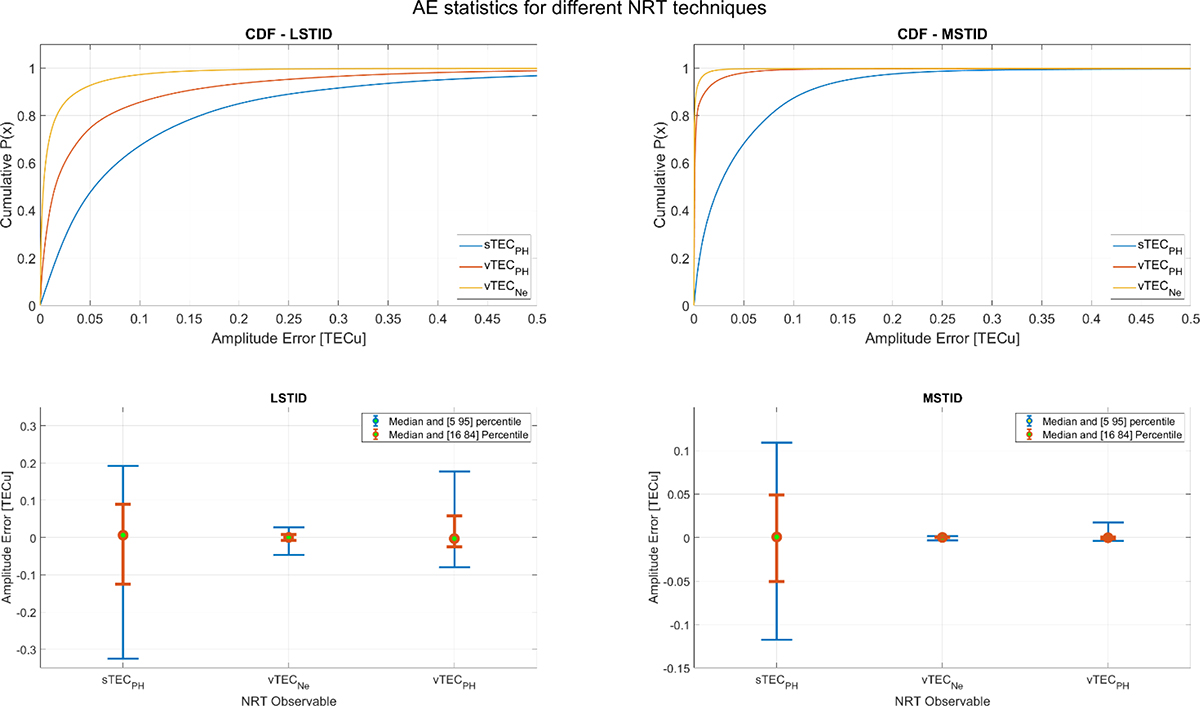
Amplitude error statistics for the NRT observables derived dTEC. The top panels show the CDF of the amplitude error, with each line representing a different observable (blue, red, and yellow for sTECPH, vTECPH, vTECNe, respectively). The X-axis shows the amplitude error, while the Y-axis is the cumulative probability. The bottom panels show the median and the 18–84 and 5–95 percentiles for the different techniques. Here, the Y-axis represents the amplitude error in TECu. The plots on the left and right correspond to LSTID and MSTID, respectively.
Current usage metrics show cumulative count of Article Views (full-text article views including HTML views, PDF and ePub downloads, according to the available data) and Abstracts Views on Vision4Press platform.
Data correspond to usage on the plateform after 2015. The current usage metrics is available 48-96 hours after online publication and is updated daily on week days.
Initial download of the metrics may take a while.