Open Access
Figure 17
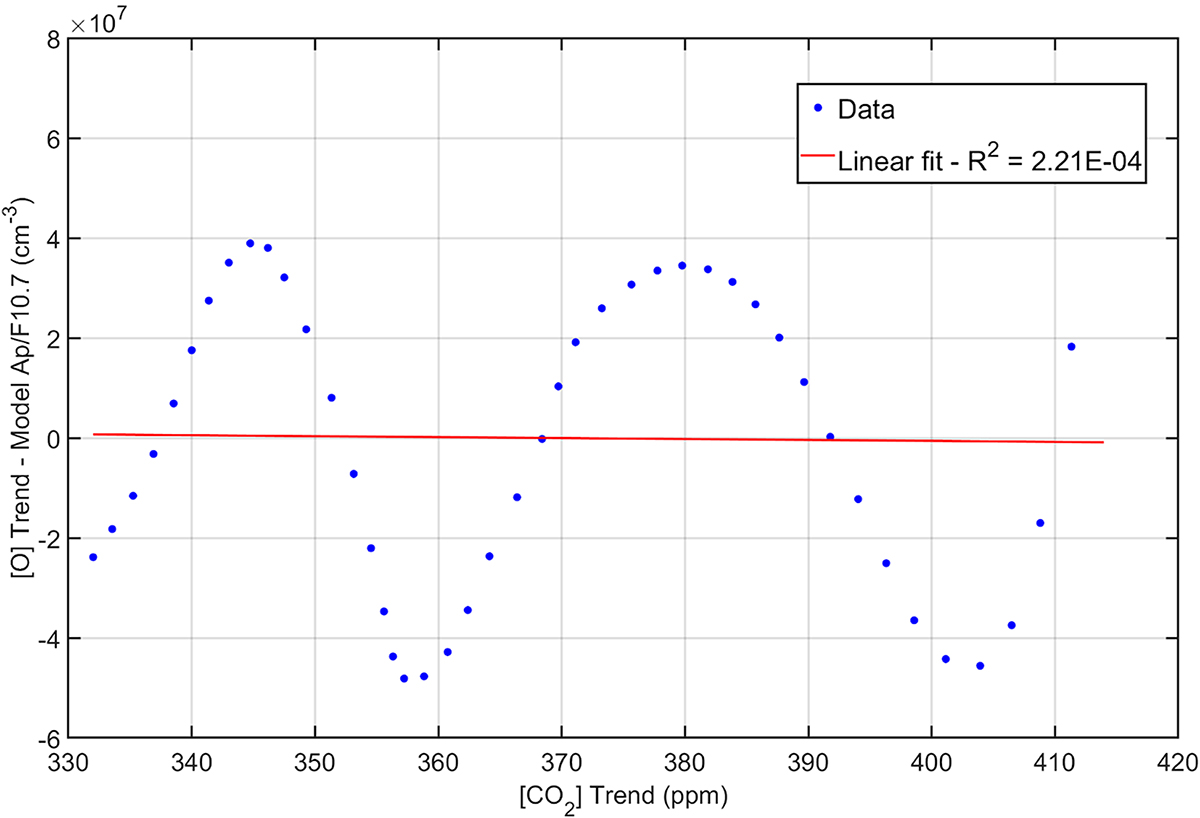
Download original image
Scatter plot of the residual between [O] trend and its modelled counterpart based on F10.7 and Ap trends against [CO2] trend in the period 1976–2021. The red line indicates the related linear fit.
Current usage metrics show cumulative count of Article Views (full-text article views including HTML views, PDF and ePub downloads, according to the available data) and Abstracts Views on Vision4Press platform.
Data correspond to usage on the plateform after 2015. The current usage metrics is available 48-96 hours after online publication and is updated daily on week days.
Initial download of the metrics may take a while.