Figure 8
Download original image
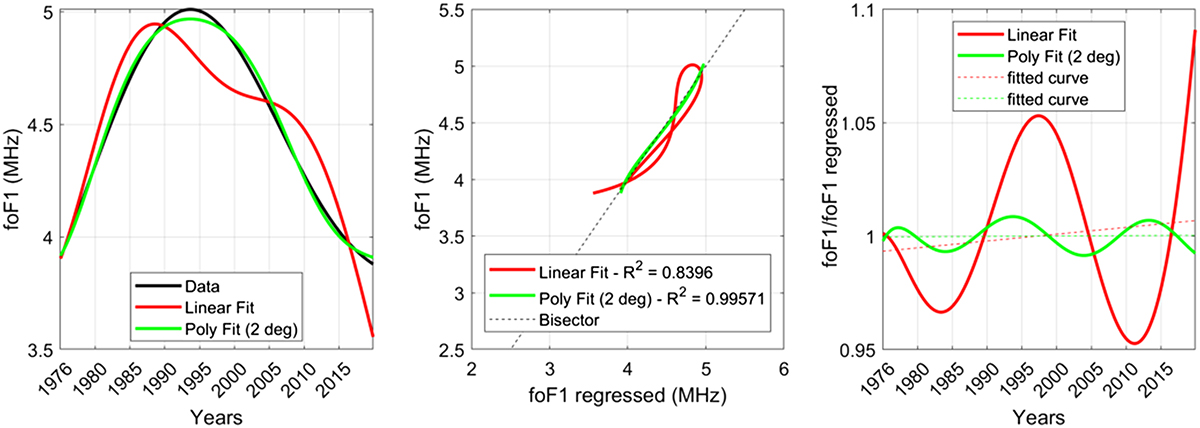
Left panel: foF1 trend (black) and related models obtained by applying a linear fit (red curve) and second-degree polynomial fit (green). Middle panel: Scatter plot of foF1 trend and related models obtained by applying a linear fit (red curve) and second-degree polynomial fit (green). The R2 of the models is reported in the legend, while the black dashed line indicates the bisector. Right panel: Time profile of the ratio between foF1 trend and the regressed models, according to the same colour code of the previous panel. The related dashed lines indicate the linear fit evaluated for the two curves.
Current usage metrics show cumulative count of Article Views (full-text article views including HTML views, PDF and ePub downloads, according to the available data) and Abstracts Views on Vision4Press platform.
Data correspond to usage on the plateform after 2015. The current usage metrics is available 48-96 hours after online publication and is updated daily on week days.
Initial download of the metrics may take a while.