Figure 13
Download original image
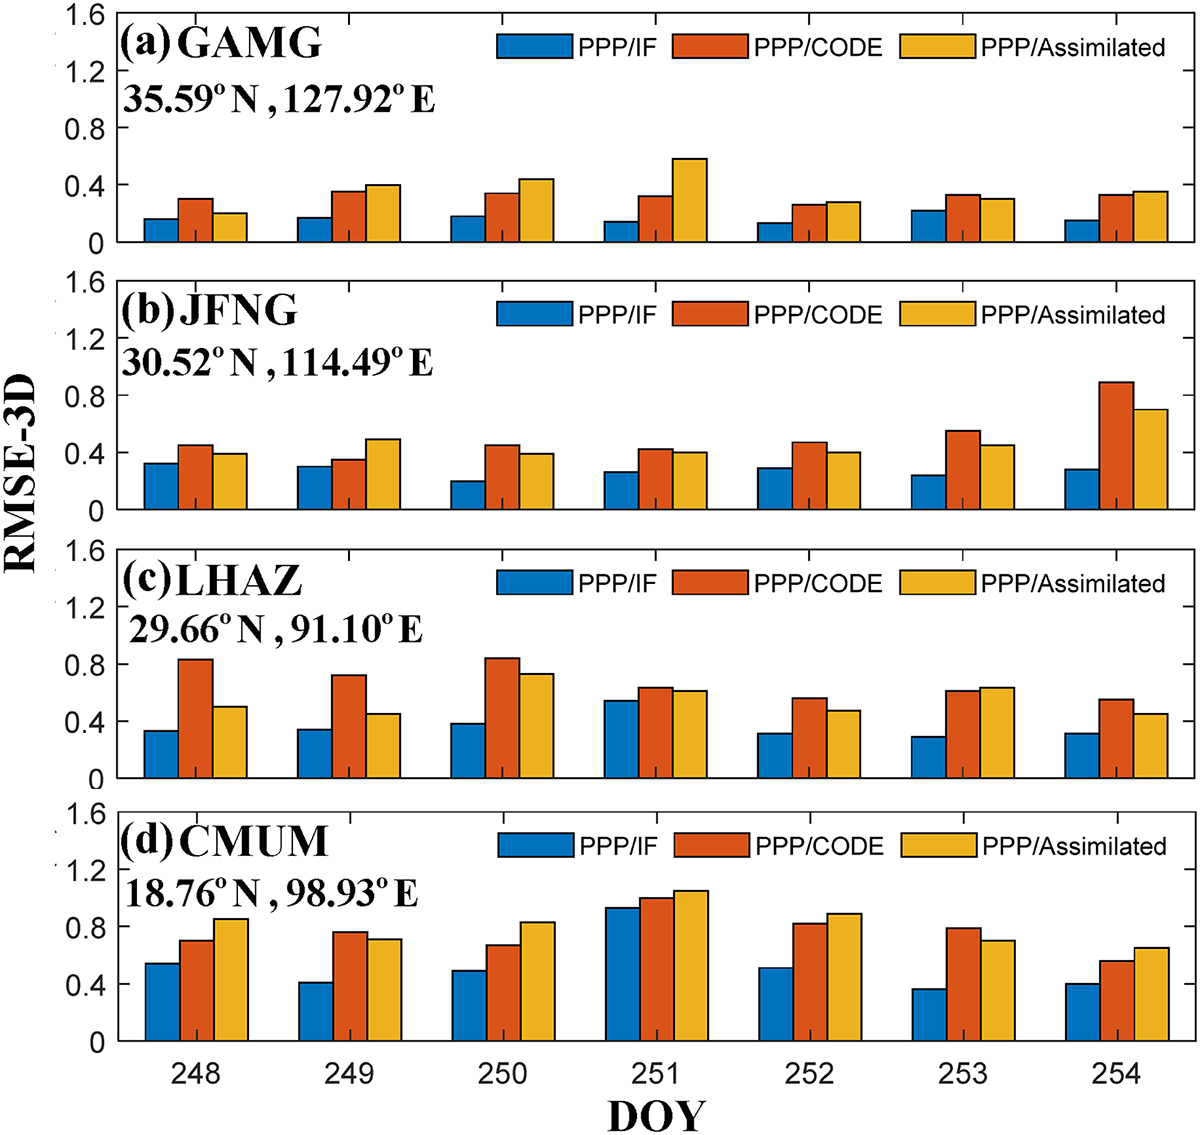
RMSE of 3D positioning with each day at different stations from September 5, 2017, to September 11, 2017. (a) GAMG; (b) JFNG; (c) LHAZ; (d) CMUM. The blue bar represents PPP/IF, the red bar represents PPP/CODE, and the yellow bar represents PPP/Assimilated using the assimilation method HBN. Shorter bars indicate a reduction in localization errors.
Current usage metrics show cumulative count of Article Views (full-text article views including HTML views, PDF and ePub downloads, according to the available data) and Abstracts Views on Vision4Press platform.
Data correspond to usage on the plateform after 2015. The current usage metrics is available 48-96 hours after online publication and is updated daily on week days.
Initial download of the metrics may take a while.