Figure 6
Download original image
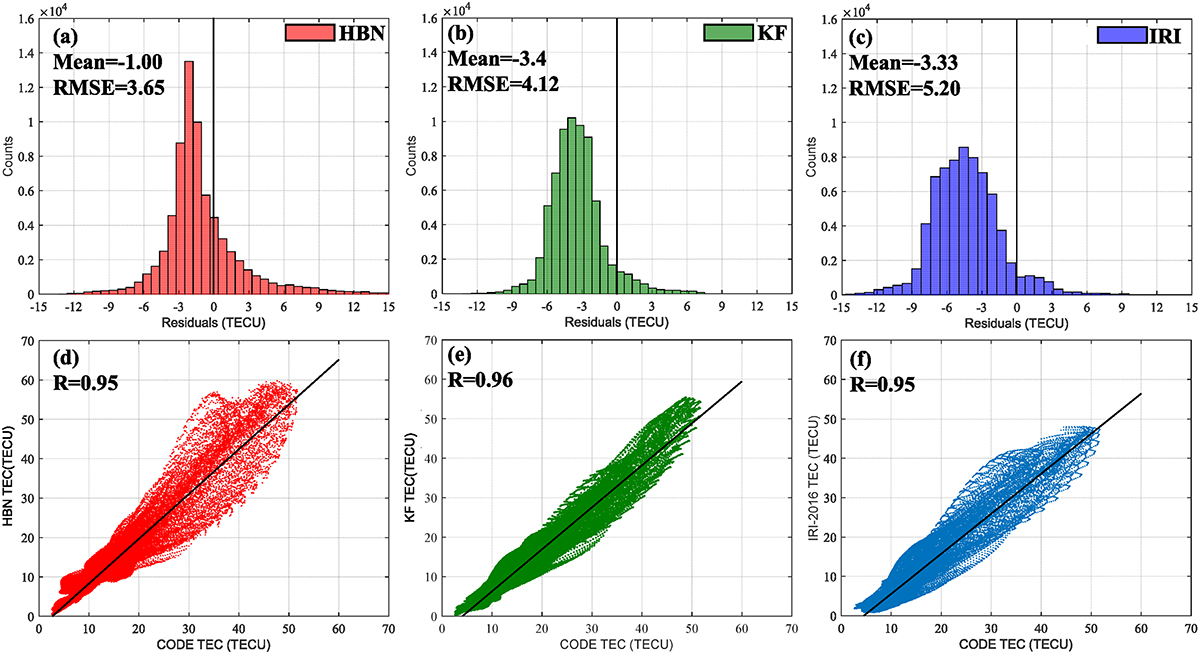
On DOY 249 (September 6, 2017), residual histograms and scatter plots compare HBN TEC, KF TEC, and IRI TEC against CODE TEC. Black solid lines in (a)–(c) indicate a mean of zero, while in (d)–(f), they represent linear regression lines, reflecting the relationship between model estimates and CODE TEC values. Note: “KF” refers to the Kalman Filter-based method for TEC estimation.
Current usage metrics show cumulative count of Article Views (full-text article views including HTML views, PDF and ePub downloads, according to the available data) and Abstracts Views on Vision4Press platform.
Data correspond to usage on the plateform after 2015. The current usage metrics is available 48-96 hours after online publication and is updated daily on week days.
Initial download of the metrics may take a while.