Figure 12
Download original image
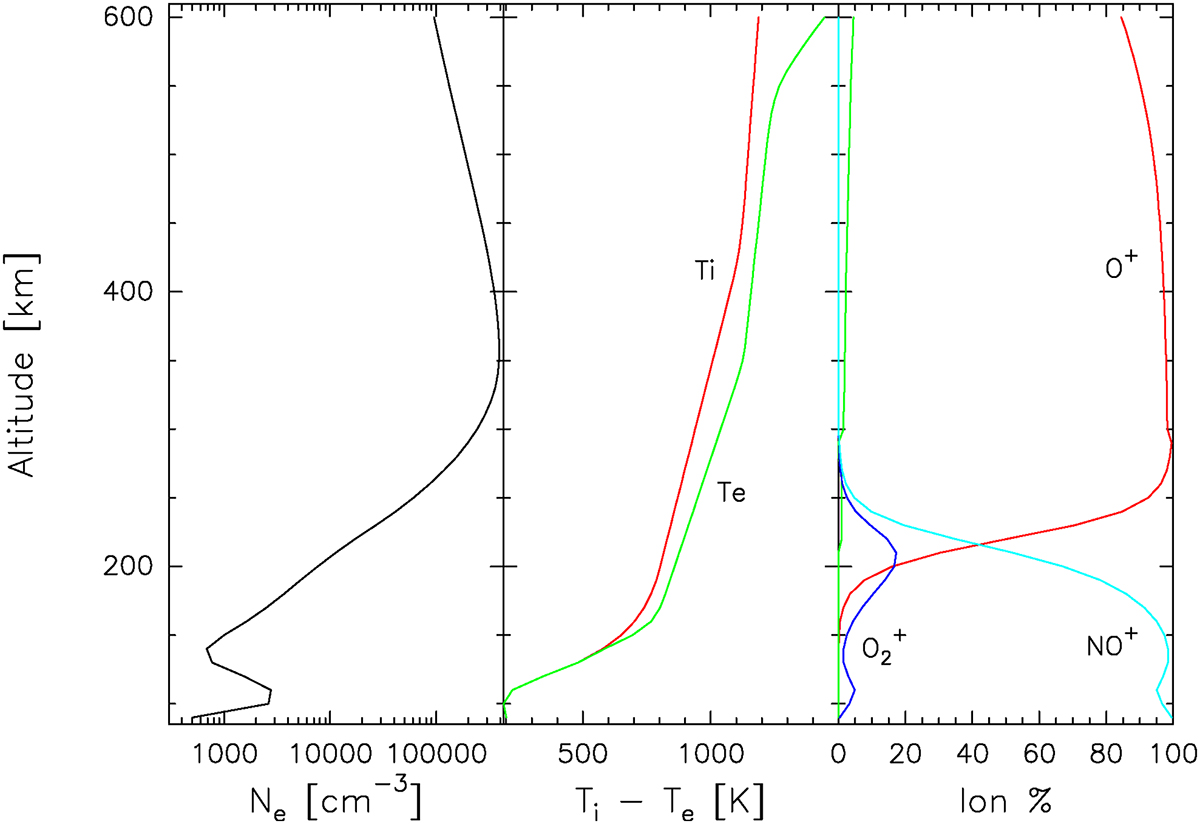
Ionospheric profiles forecasts by the IRI ionospheric model for the conditions prevailing during the observation. Left panel: Electron density. Middle panel: Ion temperature (red line) and electron temperature (green line). Right panel: ion rates. Red line: O+; Light blue: NO+; dark blue: ![]() . The other ions (N+ and H+) are shown but negligible.
. The other ions (N+ and H+) are shown but negligible.
Current usage metrics show cumulative count of Article Views (full-text article views including HTML views, PDF and ePub downloads, according to the available data) and Abstracts Views on Vision4Press platform.
Data correspond to usage on the plateform after 2015. The current usage metrics is available 48-96 hours after online publication and is updated daily on week days.
Initial download of the metrics may take a while.