Open Access
Figure 2
Download original image
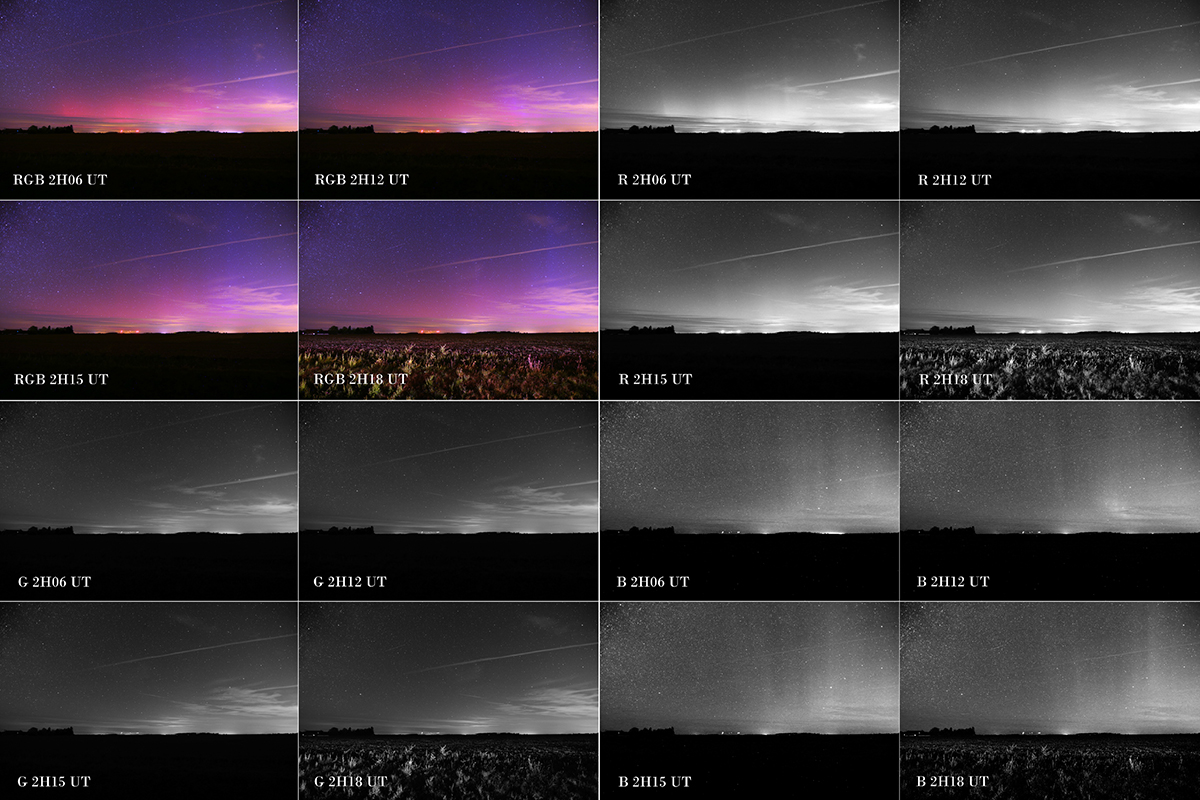
Blue and red aurora on 25 September 2023 at 2 UT (4 LT), same location as in Figure 1. The upper left four panels are the succession of frames during 12 mn duration. The different RGB channels are given on the four upper right panels (red), lower left (Green) and lower right (Blue).
Current usage metrics show cumulative count of Article Views (full-text article views including HTML views, PDF and ePub downloads, according to the available data) and Abstracts Views on Vision4Press platform.
Data correspond to usage on the plateform after 2015. The current usage metrics is available 48-96 hours after online publication and is updated daily on week days.
Initial download of the metrics may take a while.