Open Access
Figure 8
Download original image
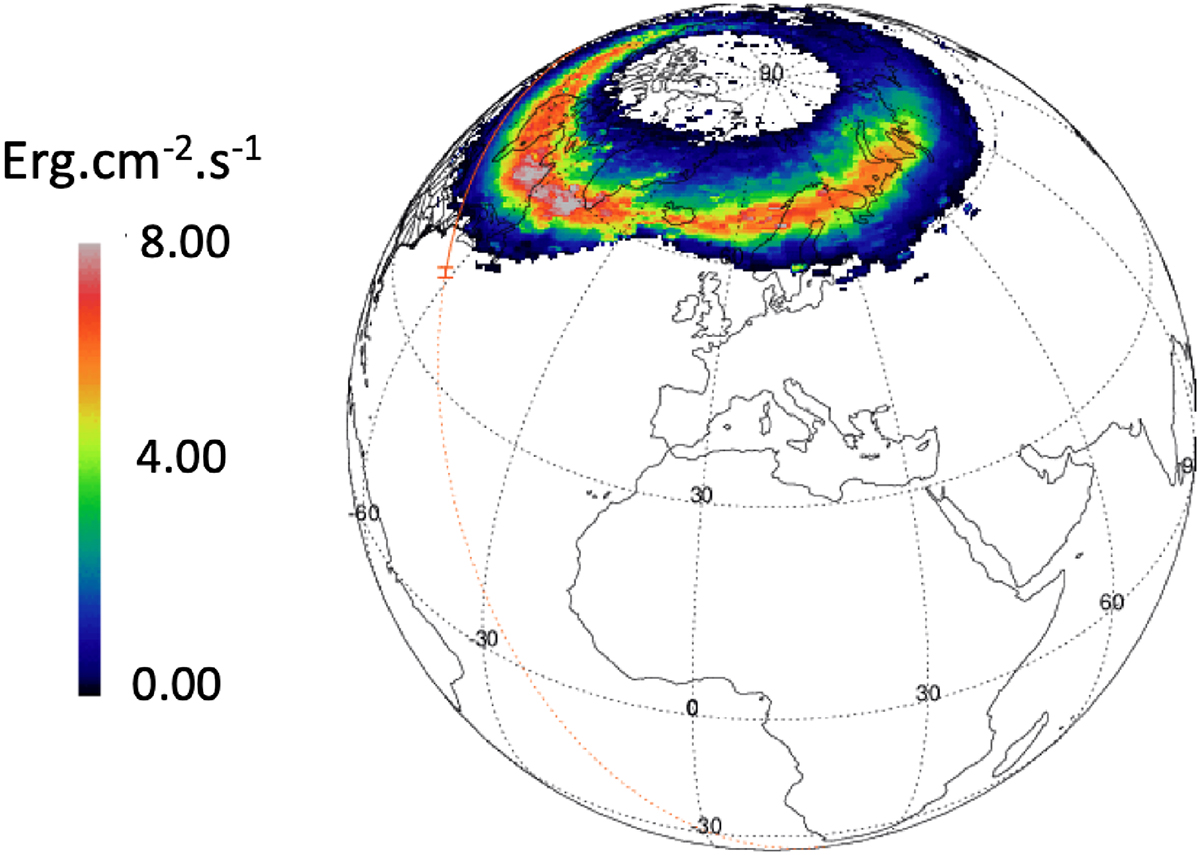
Computation of the auroral oval location from the Ovation code (see text), (Newell et al., 2014). This figure stands for the conditions prevailing during the current blue aurora observation.
Current usage metrics show cumulative count of Article Views (full-text article views including HTML views, PDF and ePub downloads, according to the available data) and Abstracts Views on Vision4Press platform.
Data correspond to usage on the plateform after 2015. The current usage metrics is available 48-96 hours after online publication and is updated daily on week days.
Initial download of the metrics may take a while.