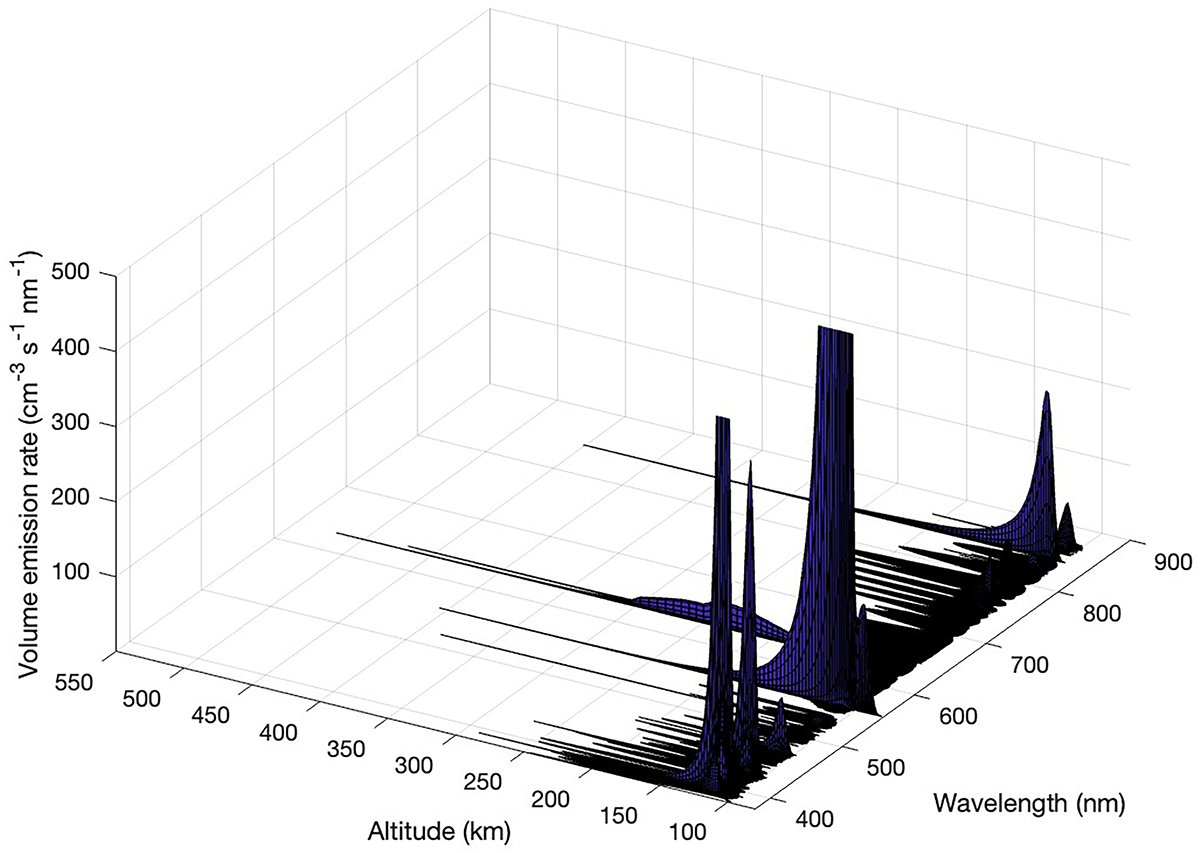
Figure 5
Download original image
3D view of the synthetic spectra as function of the altitude for Emean = 7 keV and a total flux of 10 erg · cm−2 · s−1. The maximum volume emission rates shown are of 500 cm−3 · s−1 · nm−1 to allow a better visualization of the faint lines/bands. The computed maximum of the green line for this case is 2116 cm−3 · s−1 · nm−1. Note that the mean energy used here is larger than for the previous examples to allow a better discrimination of the altitude of each emission peak.
Current usage metrics show cumulative count of Article Views (full-text article views including HTML views, PDF and ePub downloads, according to the available data) and Abstracts Views on Vision4Press platform.
Data correspond to usage on the plateform after 2015. The current usage metrics is available 48-96 hours after online publication and is updated daily on week days.
Initial download of the metrics may take a while.